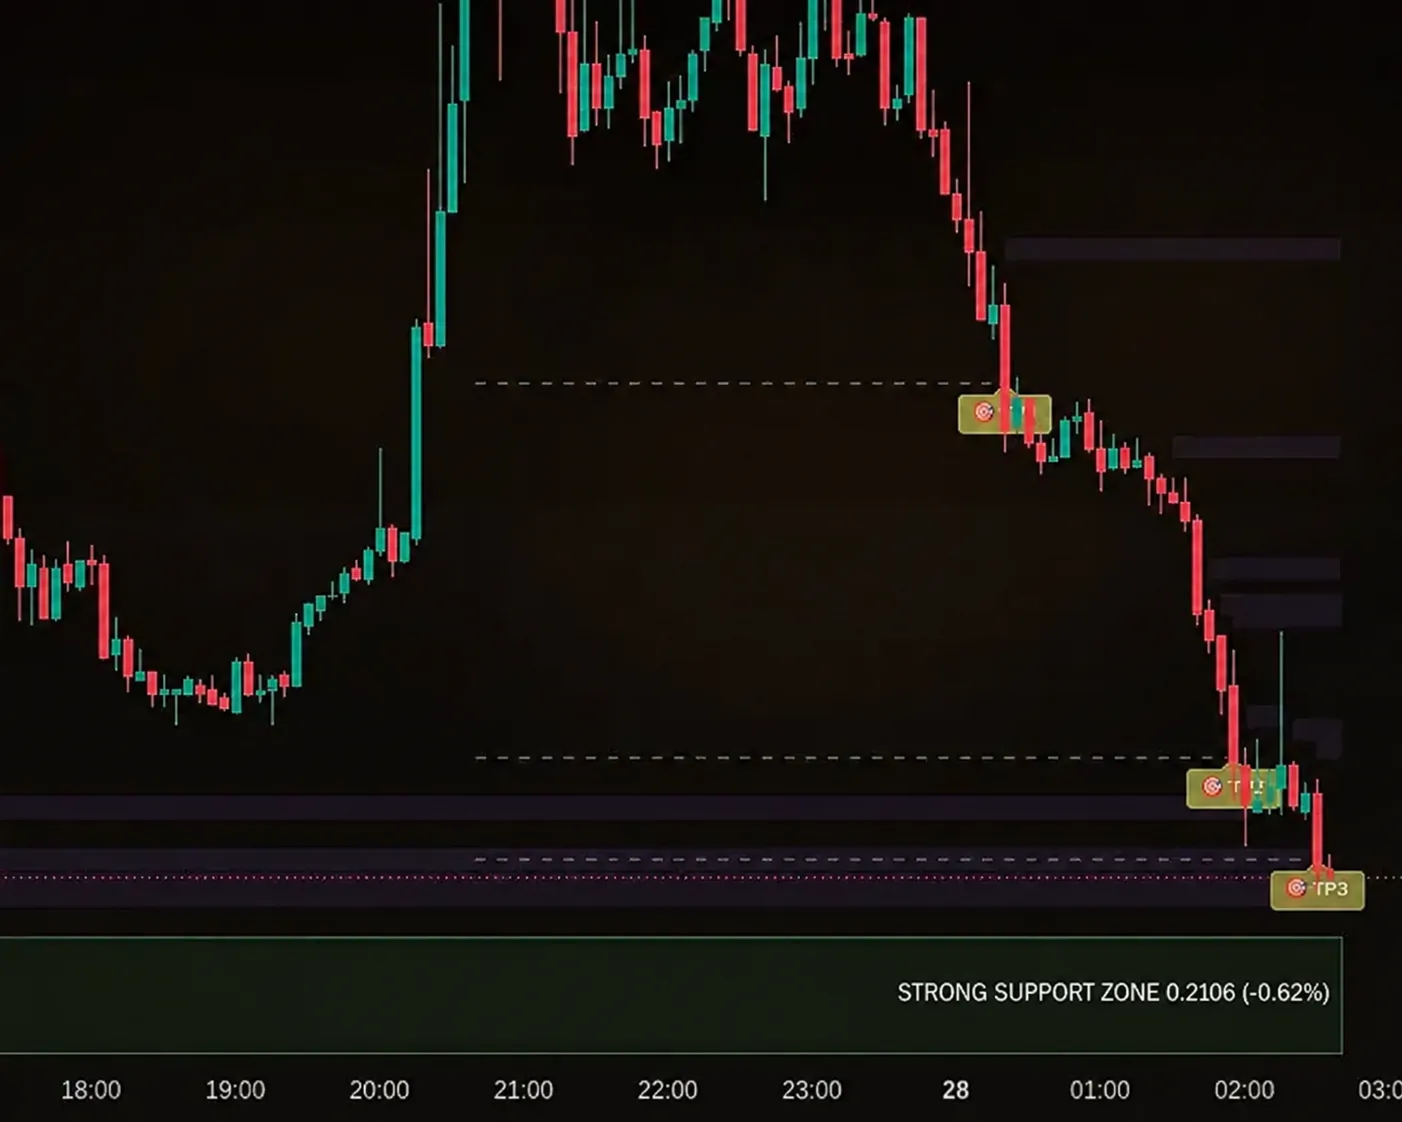
How it works

How the indicator worksMidasfor TradingView - using the example of one transaction

Midas finds entry and fixation points directly on the chart: Buy/Sell signals, stop loss and liquidity targets. This is an advisor, not a bot - it does not make trades, the decision is yours.

We do not accept deposits or manage money. Midas only marks up the chart to save you time and reduce noise.

No card. No payment. Your TradingView username is public, not a password. The bot only grants access and does not trade for you.

8,400+ installations · 300+ reviews · 5,000+ documented trade results

A minute of video instead of a page of text: what the indicator draws on the chart

01What can he do?

What Midas shows on the chart: Buy/Sell signals, stop loss and targets

On the left is what the system can do, on the right is how it looks on the graph. The tabs scroll through themselves, but you can select interesting ones manually. All this lives inside two indicators Up and Down: you don’t need to buy anything in addition.

without redrawing

Buy/Sell signals are fixed at the close of the candle

The entry mark appears at the moment the candle closes and remains in place forever - the signal does not disappear and is not redrawn retroactively. What you see in the moment will remain in history.

A signal is not a “buy” command, but a notification or alert that signals the beginning of a market movement so that you don’t sit at the charts for hours. What to do next, you decide: the indicator draws the transaction plan right there, next to the mark.

  • candle closing mark
  • Buy and Sell
  • remains in history

Upper Midas Up indicator, right on the chart. Already works in free demo.

Buy/Sell signals
stop and 3 targets

Position projection: stop loss and three targets automatically

Along with the signal, Midas immediately creates a transaction plan: the stop loss is calculated based on the current volatility and ATR + three targets for the nearest liquidity zones that will magnetize the price. Risk to profit and potential are visible immediately before entering, not after.

The main thing is clear - what you risk and how much you can take. What works next is the plan, not the nerves: the position is closed in parts, the stop is moved to breakeven.

  • stop behind liquidity level
  • goal 1
  • goal 2
  • goal 3
  • calculation by ATR

It is drawn along with the signal on the chart. Already works in free demo.
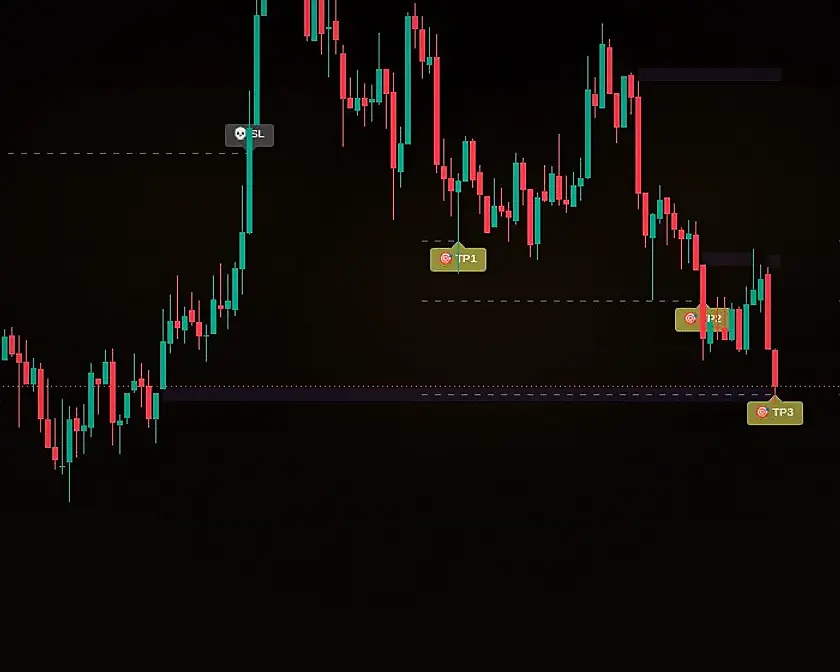
Position projection
5 presets + 2 modes

Seven trading strategies for different tasks

The strategy adjusts the indicator to your trading style, assets and timeframe: scalping provides many quick entries, intraday is the universal default mode, swings are less frequent and cleaner, investments are rare long-term ones. Scenarios for rebounds from levels and breakouts are configured separately.

The same indicator can scalp in five minutes and invest in a week.

  • Fast scalping
  • Scalping
  • Intraday
  • Swing
  • Investments
  • Bounces from levels
  • Breakouts

Indicator settings -> list of strategies. We synchronize Up with Down so that the signals match.

7 trading strategies
AI mentor

The “Setup Master” mode assembles the setup together with you

The mode turns chaos on the chart into one layout with clear text: what is the signal now, where is the trend looking and how strong is it, where are the levels, is there money behind the movement, what is the volatility and where to put a stop because of it. At the end there is a summary with an action plan.

You get an explanation of the situation and the best plan, and the decision is yours. A beginner is taught to read a chart, an experienced one works with a second pair of eyes before entering.

  • current signal
  • trend and its strength
  • levels
  • volumes
  • volatility and stop
  • action plan

Indicator settings -> Operating mode, from PC. Opens from the first paid tariff.

Interactive training
month and year

Built-in autotester checks settings on your history

The mode runs past signals on your asset and timeframe and shows statistics directly on the chart - for the month and for the year. This way you compare strategies and filters with each other and choose what works best in your market.

The picture shows a run on the daily BTCUSDT chart: over 3 years, 82.18 percent of signals were closed without a stop loss, over 3 months - 85.71. This is the story when entering ALL signals in a row, without selection; on other assets and settings the figure is different, on average 50-55 percent. Past performance does not guarantee future performance.

This is a ruler for calibrating settings, and not an accurate forecast of the result: the tester counts the entry into all signals in a row, blindly, and a live trader does not trade like that. The income column is also the result of a run through history, and not the money in the account: everyone has their own risk per transaction, volume and discipline.

  • your asset
  • your timeframe
  • comparison of strategies
  • filter comparison

Indicator settings -> Operating mode. Opens from the first paid tariff.

History check
clean schedule

Filters remove weak signals against the trend

Without a filter, there are many signals and half go against the movement. The filter leaves only those that look towards the market: Buy - when the trend is up, Sell - when it's down. The graph becomes cleaner and the entries are more logical.

It’s easier to start with the price channel - the most obvious option. EMA 200 works more strictly: signals are shown only on their side of the average. Two more options are cash flow and trend feed. Experienced ones can filter transactions themselves.

  • price channel
  • EMA
  • cash flow
  • trend feed

Indicator settings -> Signal filter. There will be fewer signals - this is planned.

Weak Signal Filter
30+ parameters

Instant technical analysis: signal reliability in one summary

The indicator itself queries three dozen parameters - trend, oscillators, volumes, levels, divergences, overheating - and brings them into a short table with an assessment of how strong the current signal is. Instead of ten windows with different opinions, one screen with the answer.

The summary does not replace your head. This is a quick answer to the question “is it worth delving into this chart right now?” - just hover your mouse over the signal.

  • trend
  • oscillators
  • volumes
  • levels
  • divergence
  • overheating

The component of the upper Midas Up indicator is visible directly on the chart. Already works in free demo.
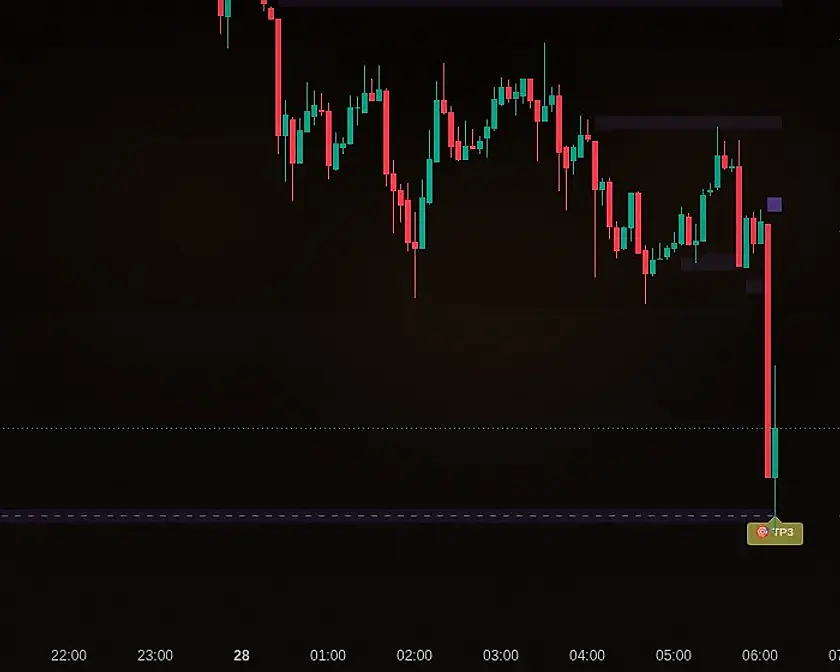
Instant technical analysis
don't sit on the schedule

Alerts: the signal comes with analysis and a screenshot of the chart

There is no need to sit in front of the monitor for hours - the indicator itself will tell you when the asset began to move. The easy way: notifications in the TradingView app, work on any tariff. Advanced: your own alerts in Telegram.

There is no need to pay for TradingView: Midas has ready-made screeners for hundreds of the most popular assets - they themselves send a signal with analysis and a screenshot of the chart. Screeners open from the first paid plan.

  • in-app notification
  • your own link in Telegram
  • screenshot of the graph in the message

Indicator menu -> “Add alert”. Already works in free demo.

AI alerts in Telegram
30+ indicators

Thirty-plus indicators in two TradingView slots

Up and Down are not two indicators, but two assemblies. Inside are moving EMAs, price channel, support and resistance levels, volume profile, liquidity heat map, whale movements, money flow, trend feed, price momentum, volume delta...

Even the free TradingView plan is enough: the entire analysis fits into two free slots. Unnecessary things are turned off in the settings to free up the schedule.

  • EMA
  • price channel
  • levels
  • volume profile
  • liquidity card
  • whale movement
  • delta volumes

Everything is already inside Up and Down. There is no need to buy anything additional.

30+ indicators
02Live

What it looks like live: different markets and timeframes

The bundle works with markets available in TradingView on timeframes from 1 minute to a month; settings are selected based on the asset and trading style. Click on the frame to expand it full screen.

BTC/USDT · 4HDigital assets
Sell at resistance, stop above the zone, the first two targets have already been met
AAPL · 1DUS stocks
Strong Buy along the trend, stop under support, risk to profit 1:3.1
SBER · 1DRussian Federation shares
Buy after removing liquidity, three targets above, risk to profit 1:4.5
XAU/USD · 1HGold
Sell from resistance, short stop, first target already taken
XAG/USD · 4HSilver
Sell along the trend, stop above the zone, risk to profit 1:6.9
UKOIL · 4HOil
Strong Buy at support, stop behind the tail of the candle, risk to profit 1:5.4
EUR/USD · 1HForex
Sell at the border of the range, stop next to the entry, risk to profit 1:3.5
ES1! · 15mS&P 500 Index
Intraday Sell sideways, stop above the upper border

This is real footage of TradingView with our indicators, taken on July 31, 2026. The numbers in the analysis panel are the historical statistics of the instrument at this setting, and not a promise of future profits.

03EXAMPLE transaction

Transaction analysis: from signal to exit

Step by step - what the indicator does and what remains for the person.

01

Signal

When the candle closes, Midas prints a Buy signal: you analyze the chart using the System and make your own decision on entry. The signal is not redrawn and remains in the chart history forever.

TradingView frame
02

Entry and stop

Together with the signal, the indicator builds a projection of the position: entry is based on the market, stop is calculated based on volatility, where the scenario breaks down. The risk is fixed by the rule before entering, and not by the emotion after.

TradingView frame
03

Three goals

The targets are set according to the nearest zones of liquidity, which will magnetize the price. Near - conservative fixation, distant - if the movement opens up. The transaction plan is immediately visible: there is no need to count and draw with your hands.

TradingView frame
04

Escort

The price moves towards the targets - part of the position is closed at the first, the stop is moved to breakeven. What works next is the plan, not the nerves: every action was planned in advance. Each step comes with an explanation in the alerts.

TradingView frame
05

And it also happens: minus

But here the signal did not work - the price went against the entry. It happens: Midas is an analysis tool, not a “golden grail” or a ready-made “login” button. The stop worked - the loss is limited by a clear rule, and not by emotions. Some signals always close negative; The question is not that they should not exist, but that the minus should be less than the plus at a distance.

TradingView frame
06

Test of time

This is just one deal from history - not a promise that it will always be this way. Therefore, we do not ask you to take our word for it: already in the free demo, turn off the “Display only the latest signal” option in the settings and look at the signals on your asset for the last few months or years. And the built-in autotester, which itself calculates settings statistics, opens from the first paid tariff.

Check it out for yourself

Fresh analyzes of transactions are published in the channel every morning. There you will also find examples of analysis work and transactions of other traders.

Open a channel with analysis
04No redrawing

Why doesn't Midas redraw signals?

Redrawing is the main focus of “beautiful” free indicators: bad signals disappear after the candle closes, and only ideal entries remain in history. Midas prints a signal once and it stays forever.

Signal - when the candle closes

While the candle is alive, there is no signal. Closed - the signal is printed and will not change again. The past on the Midas chart looks exactly the same as it looked in the moment.

Check the market simulator

TradingView has a “Simulator” mode: rewind the chart and play the history candle by candle. Midas signals will appear in the same place where they appear in history.

Run it with an autotester

The built-in Midas autotester runs signals throughout the entire history of your asset and shows performance statistics. It opens from the first paid tariff - it already counts on your chart, and not on ours.

Is this not enough? We've figured out how to test us in 10 minutes - see reviews page.

05Workouts

Examples: how signals and trades are processed

Our bot works in an open group: when the price on a signal reaches the third target, it publishes a post with a screenshot. Here are the last three entries - you can see the signal point, all three targets and how far the price has moved from the entry.

The bot writes only about achieved goals, so this is not a win rate or complete statistics. Just an example of working on one of the topics of our screener.

The entire training tape and how to read it
06Differences

How Midas differs from free TradingView indicators

Free indicators are scattered noise: one draws a trend, the second levels, the third beeps on every movement, and all of this needs to be collected, configured and verified manually. Midas is a ready-made system: signal, stop, targets and assessment of the situation in one place for all top instruments at once, even on the free TradingView plan.

Analysis of the market without a system

  • 5-8 indicators on the chart, each with its own opinion
  • Manually sorting through dozens of assets
  • Stops and targets - by eye, after entry
  • Signals from other people's channels without explanation

Market analysis with Midas

  • One link Up + Down: trend, levels, volumes, liquidity
  • The screener itself sends assets with ready-made analysis
  • Stop and 3 targets are built according to a clear system before entry
  • It’s clear why the signal appeared - and what to do next
07Tools

Tools: what's included in Midas PRO

Three tools are the whole base: they are included in any paid plan, from a month to a year, and cover the three main pain points of any trader.

Included in any tariff

The flagship base of Midas PRO. The subscription period does not affect this composition - it is the same for both a month and a year.

Midas Up + Down (what's on the chart)

A flagship combination of two indicators: Buy/Sell signals, stop loss and liquidity targets, trend, levels, volumes - the entire analysis of the chart in two indicators.

Where does he live?: Also available in free demo

Screeners (what to trade)

They continuously monitor 1,000+ assets in six classes of markets and send a ready-made analysis to Telegram with a screenshot of the chart - instead of manual search and chaos in the market.

Where does he live?: From the first paid tariff

VIP club (how to develop)

Closed community: daily trade reviews, mentors, training courses, chat with developers and live support from other traders - you don’t have to grow alone.

Where does he live?: From the first paid tariff
Additionally

They open for a subscription period - the longer the tariff, the more instruments on the chart.

MultiTrend

Traffic light of the trend for all timeframes at a glance: where is the impulse, where is the correction, where is it better not to stand against the market.

Where does he live?: From 3 months

Pump&Dump

Catches deep pullbacks after sharp impulses: where the movement has fizzled out and where the price is likely to return in a short period of time.

Where does he live?: From 6 months

Trading bot BackTester

The universal designer of trading bots based on signals is a separate tool for full-fledged algorithmic trading.

Where does he live?: From 12 months
What opens with the subscription period

For whom Midas is not suitable?

Midas is not suitable if you are looking for a “money” button, are waiting for passive income without work, are not ready to learn, or are looking for a bot that trades for you. Midas helps you make decisions - the decision is always yours.

Midas is not a broker or a fund

Midas is an indicator for the most advanced analysis and automation of the search for the most promising assets. We do not accept deposits or manage your money. You trade where you traded.

08Questions

Frequently asked questions about Midas

Is Midas the same as Paul Levine's MIDAS VWAP?

No. Midas (Up + Down) is an independent indicator for TradingView from the Midas team: Buy/Sell signals, stop loss and targets on the chart. Paul Levine's classic MIDAS VWAP method is another tool with a similar name, we are not affiliated with it.

Is Midas a bot or a broker? Is he trading for me?

No. Midas is an analyzer: it marks the chart and builds a trade plan, but does not make trades and does not accept money. You trade yourself, on your own exchange and your account - the decision is always yours.

What's included in the 7-day free trial?

Two flagship indicators Midas Up and Down on their chart: Buy/Sell signals, stop loss and three targets, trend, levels and volumes. You don't need a card, there are no auto-debits - after 7 days, access will simply end on its own. Screeners, autotester, Setup Master mode and bonus indicators are available from the first paid tariff.

What markets does Midas operate in?

With markets available in TradingView: stocks, forex, indices, commodities and futures. Timeframe range - from 1 minute to a month; preset and settings are selected to suit the asset and trading style.

Are the signals really not redrawn? How can I check this?

The signal is printed when the candle closes and does not change anymore. You can check it without us and for free: the Bar Replay mode in TradingView plays the history candle by candle, and in the demo you just need to turn off showing only the last signal and go through the history of your asset. The built-in autotester, which calculates statistics for you, opens with the first paid tariff.

Do I need a paid TradingView?

No, the free plan is enough. Midas Up and Down - assemblies of multi-indicators: the entire chart analysis fits into two free TradingView slots; you don’t have to pay extra for the slots.

While you are watching the demo, you may already be asked what kind of indicator it is. Bring the same ones - the affiliate program pays 30% of their payments. Affiliate programme

Your move

Try Midas free for 7 days

01

Click the button

Our Telegram bot will open - it will give you a demo automatically.

02

Send your TradingView nickname

This is a public login, not a password - access comes through it.

03

Check on your chart

Both are flagships in your TradingView. A week - and the decision is yours.

No card and no paymentDoesn’t write off or renew itselfIn the demo there are 2 indicators: Up + DownThe bot only gives access, does not impose signals

Still thinking? Subscribe to the channel and watch Midas in action.

Have you seen how it works? Next - Midas tariffs and prices or real customer reviews.

TradingView chart with Buy and Sell signals from the Midas indicator
Midas multi-indicator for TradingViewOne of the most advanced indicators for trading
  • Non-repainting signals
  • Interactive technical analysis
  • 7 strategies to choose from
Midas multi-indicator for TradingViewSignal, stop, and 3 targets - directly on the chart
  • Signal locks at candle close
  • Stop and 3 targets build automatically
  • The trade plan is visible before entry