
Midas Help and Frequently Asked Questions
Midas chart symbols
Complete Midas chart guide
A video walkthrough of Midas Up and Midas Down, every chart symbol and the order in which to read them.
Watch on YouTubeSignals and technical analysis
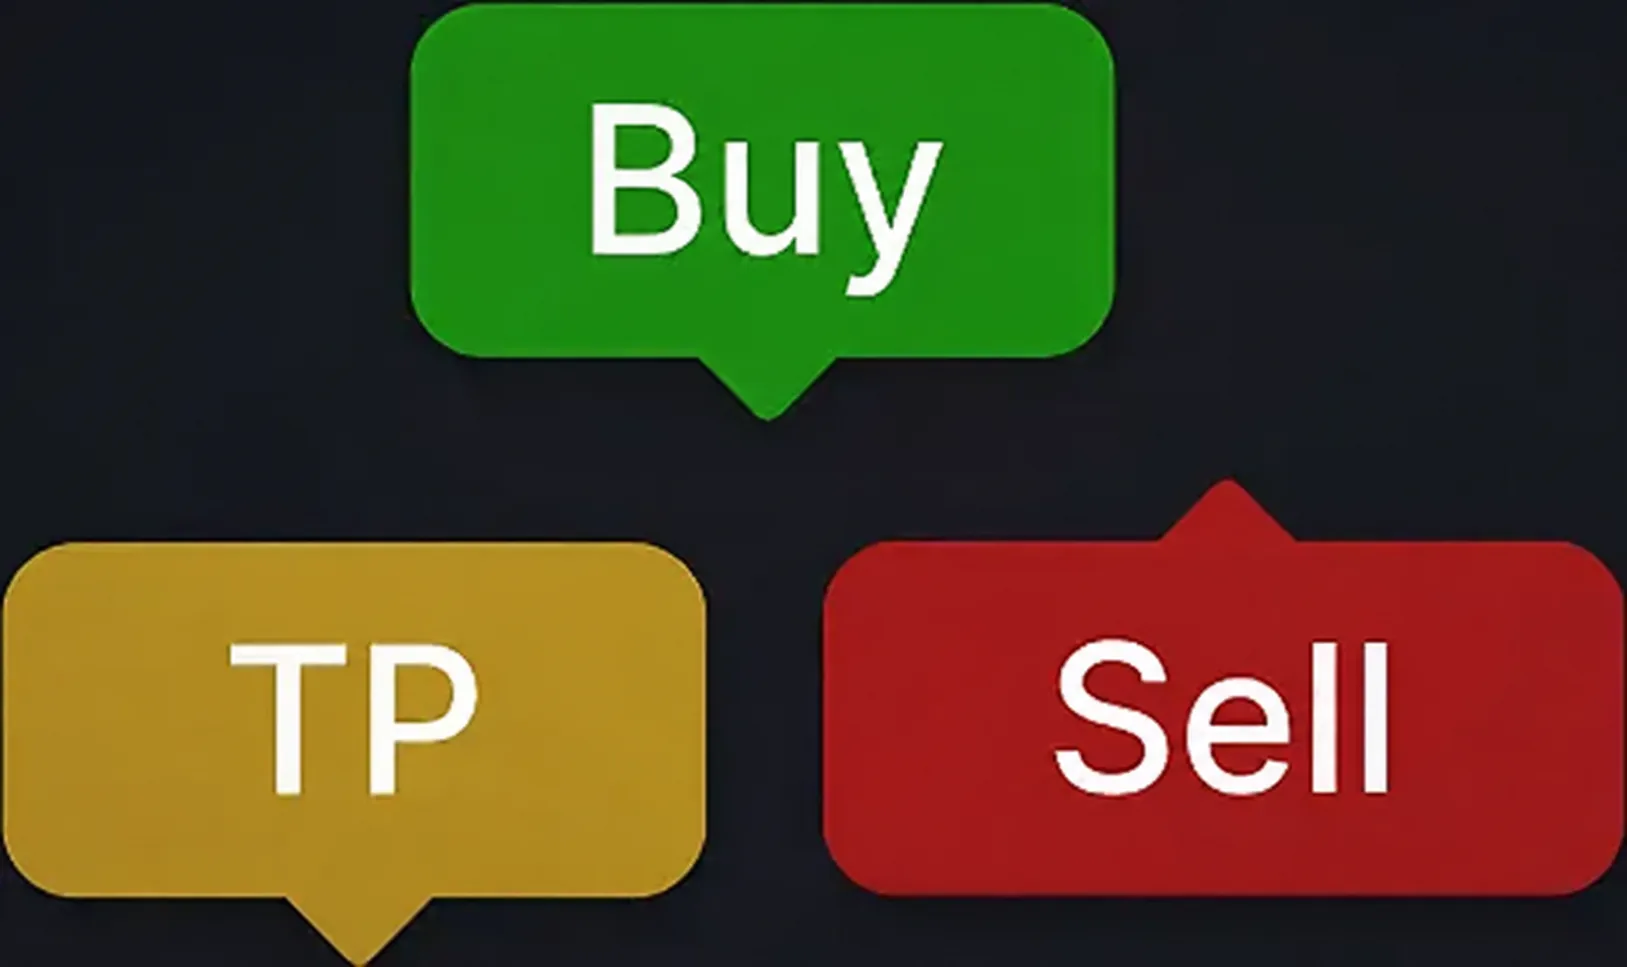 SignalsSignals that do not repaint over time show the start of a price rise or fall. Choose from seven modes: scalping (two lightning bolts or one), intraday, swing, investing, a bounce off a level or a level breakout.Step 2: read a signal
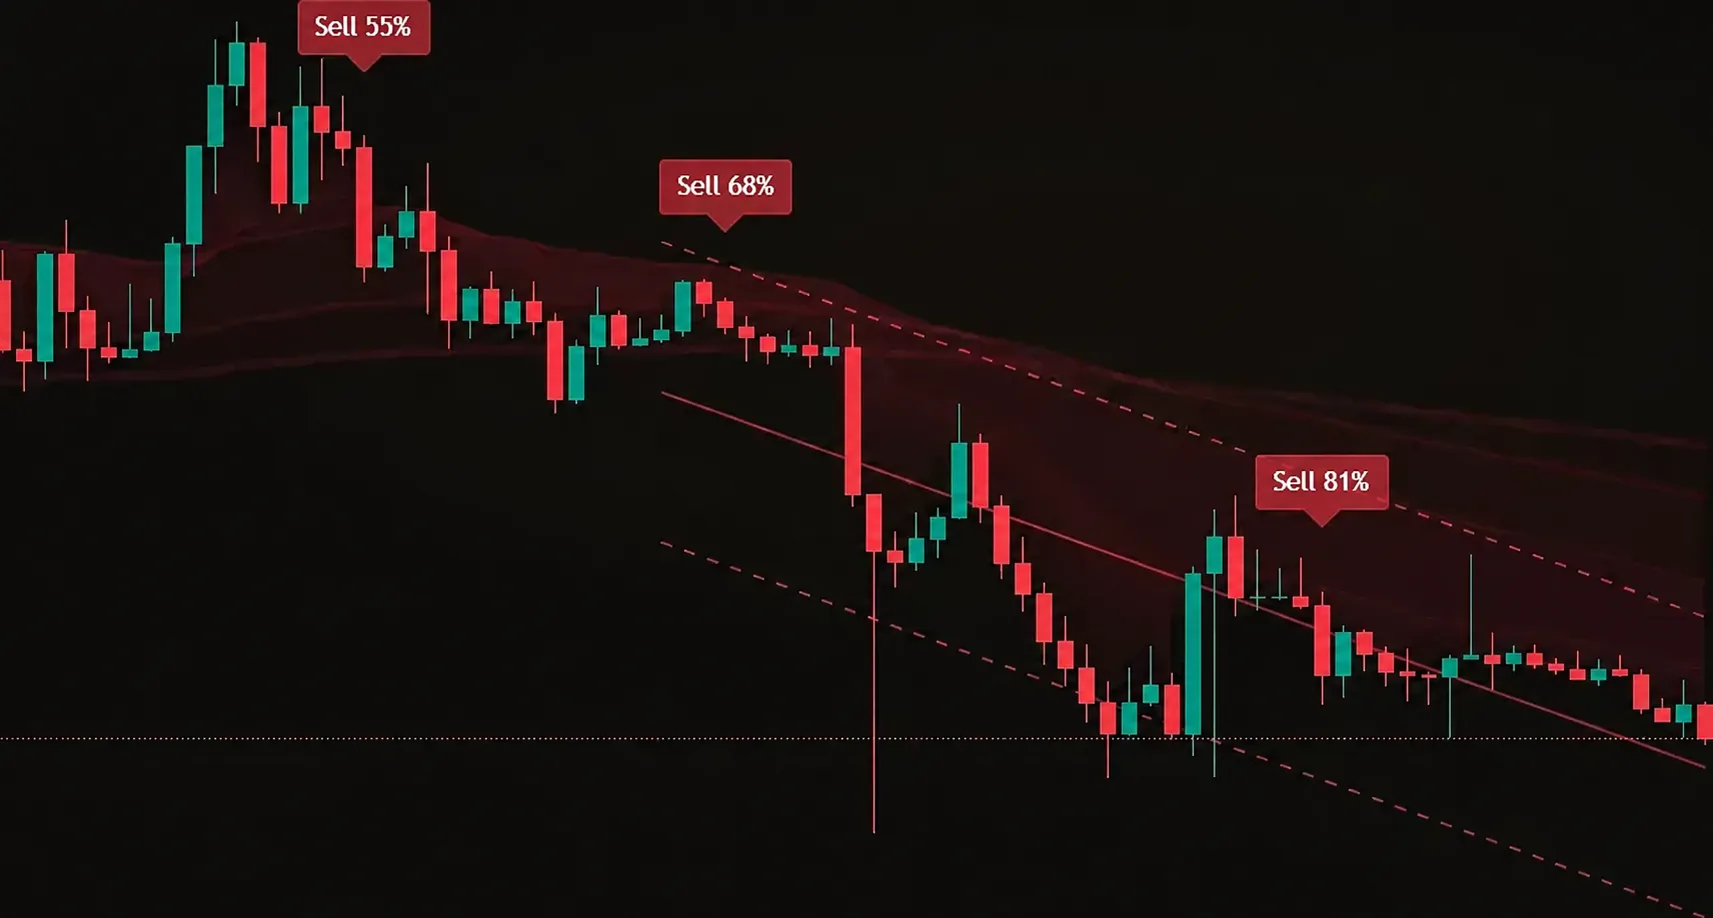 Signal reliabilityAutomatically assesses whether each built-in indicator is bullish or bearish, counts the factors that agree on a 30-point scale and converts the score to a percentage. This measures agreement between factors, not the probability of a successful trade.Step 2: read a signal
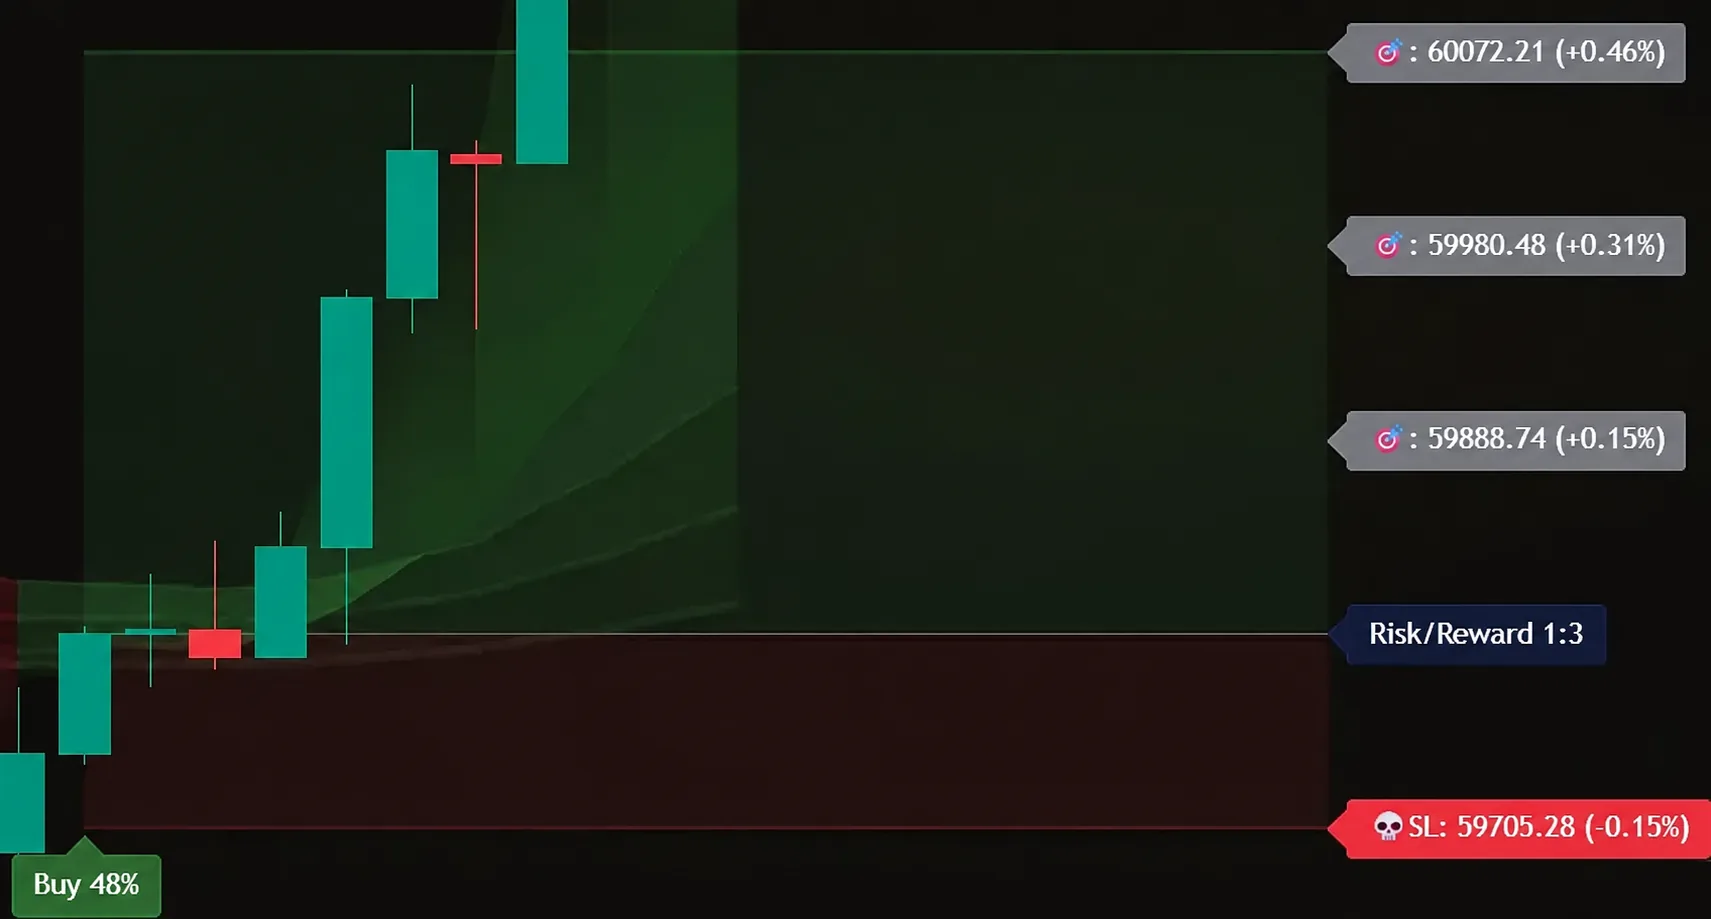 Position projectionAutomatically determines targets and risk from the nearest liquidity zones. The stop is calculated using current volatility and ATR to help reduce risk.Step 2: read a signal
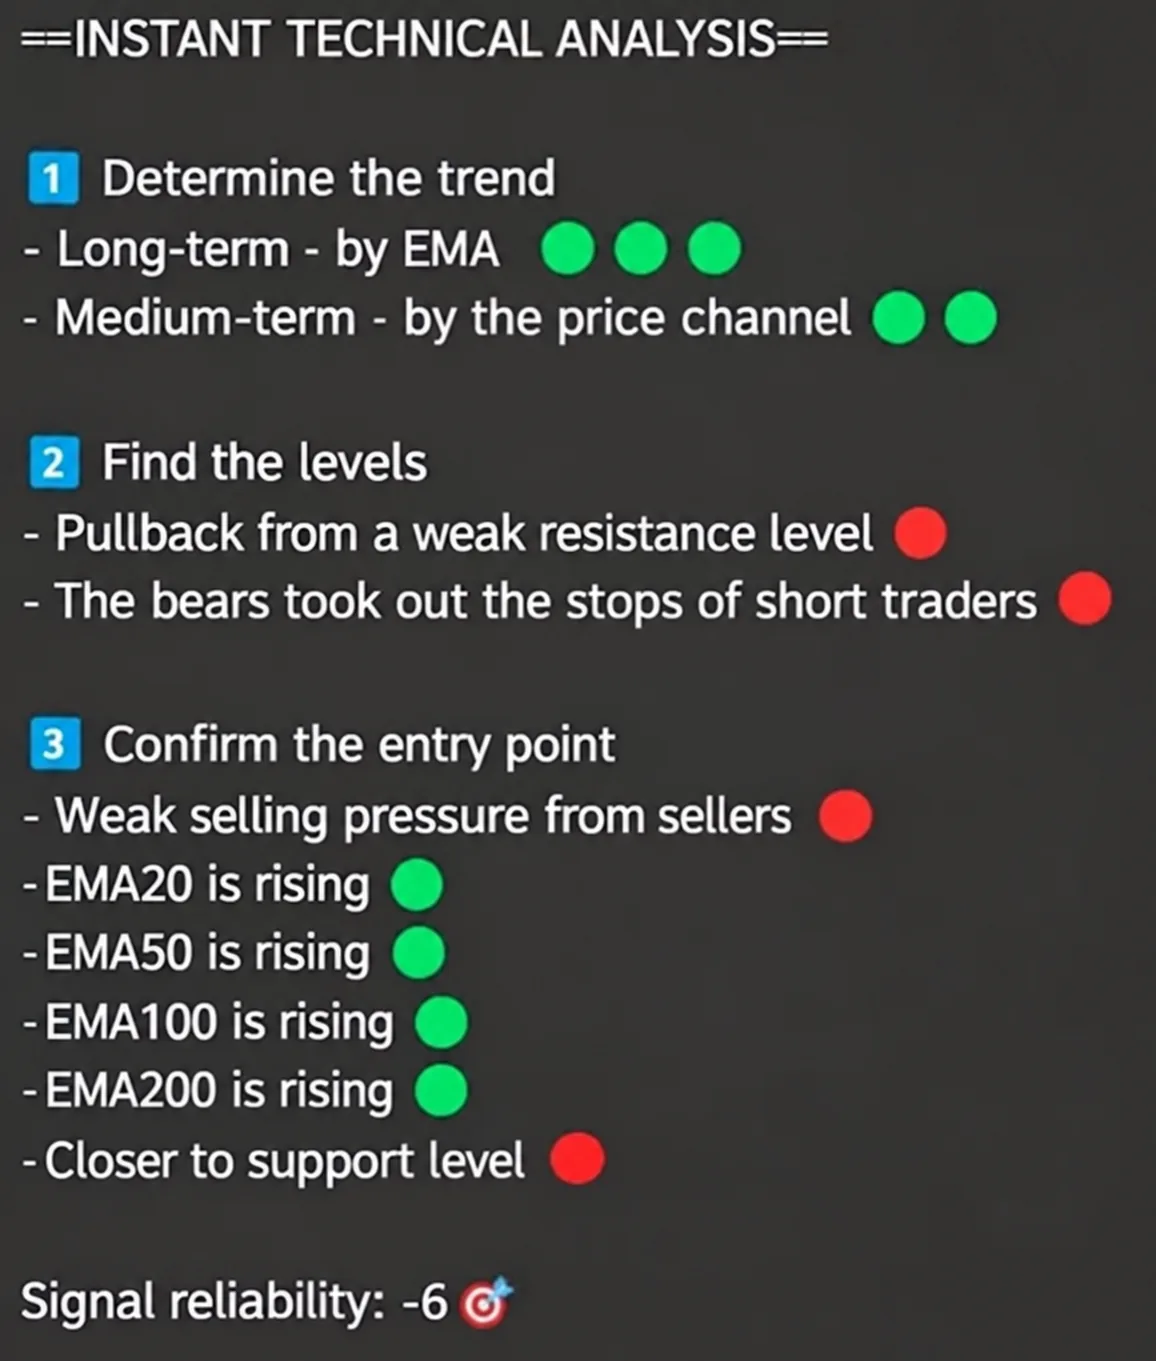 Instant technical analysisShows tooltips for each signal with a breakdown of the technical analysis and a description of the current market situation in clear, straightforward language.Step 3: analyse the chart
 Setup Master AIA new approach to technical analysis: creates a ready-to-use trading plan with clear chart analysis and specific actions focused on protecting your capital, not chasing imaginary multiples.Step 3: analyse the chart
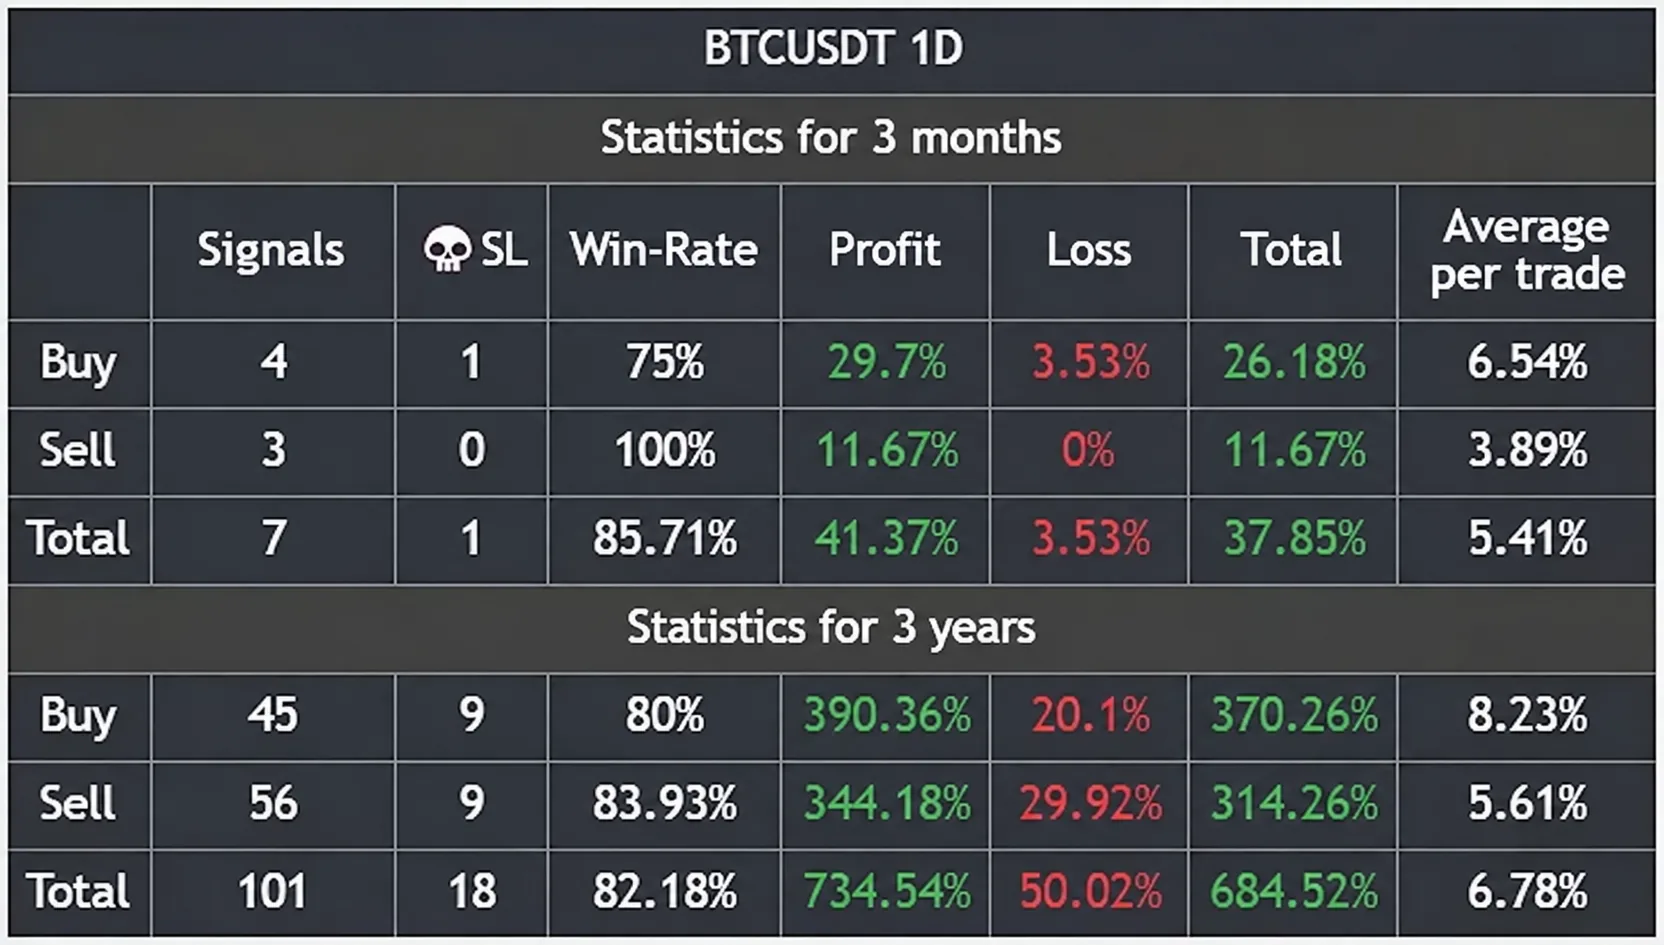 Use the TradingView Indicator Auto Tester in MidasAuto Tester helps compare settings on the selected historical data. The result describes that test, not a future return.Open guide: Use the TradingView Indicator Auto Tester in Midas
Midas Up: upper-chart indicator
 Read Trend with the EMA 20 50 100 200 Trend IndicatorThe EMA set provides a layered view of recent and longer price behaviour; it does not define an entry by itself.Open guide: Read Trend with the EMA 20 50 100 200 Trend Indicator
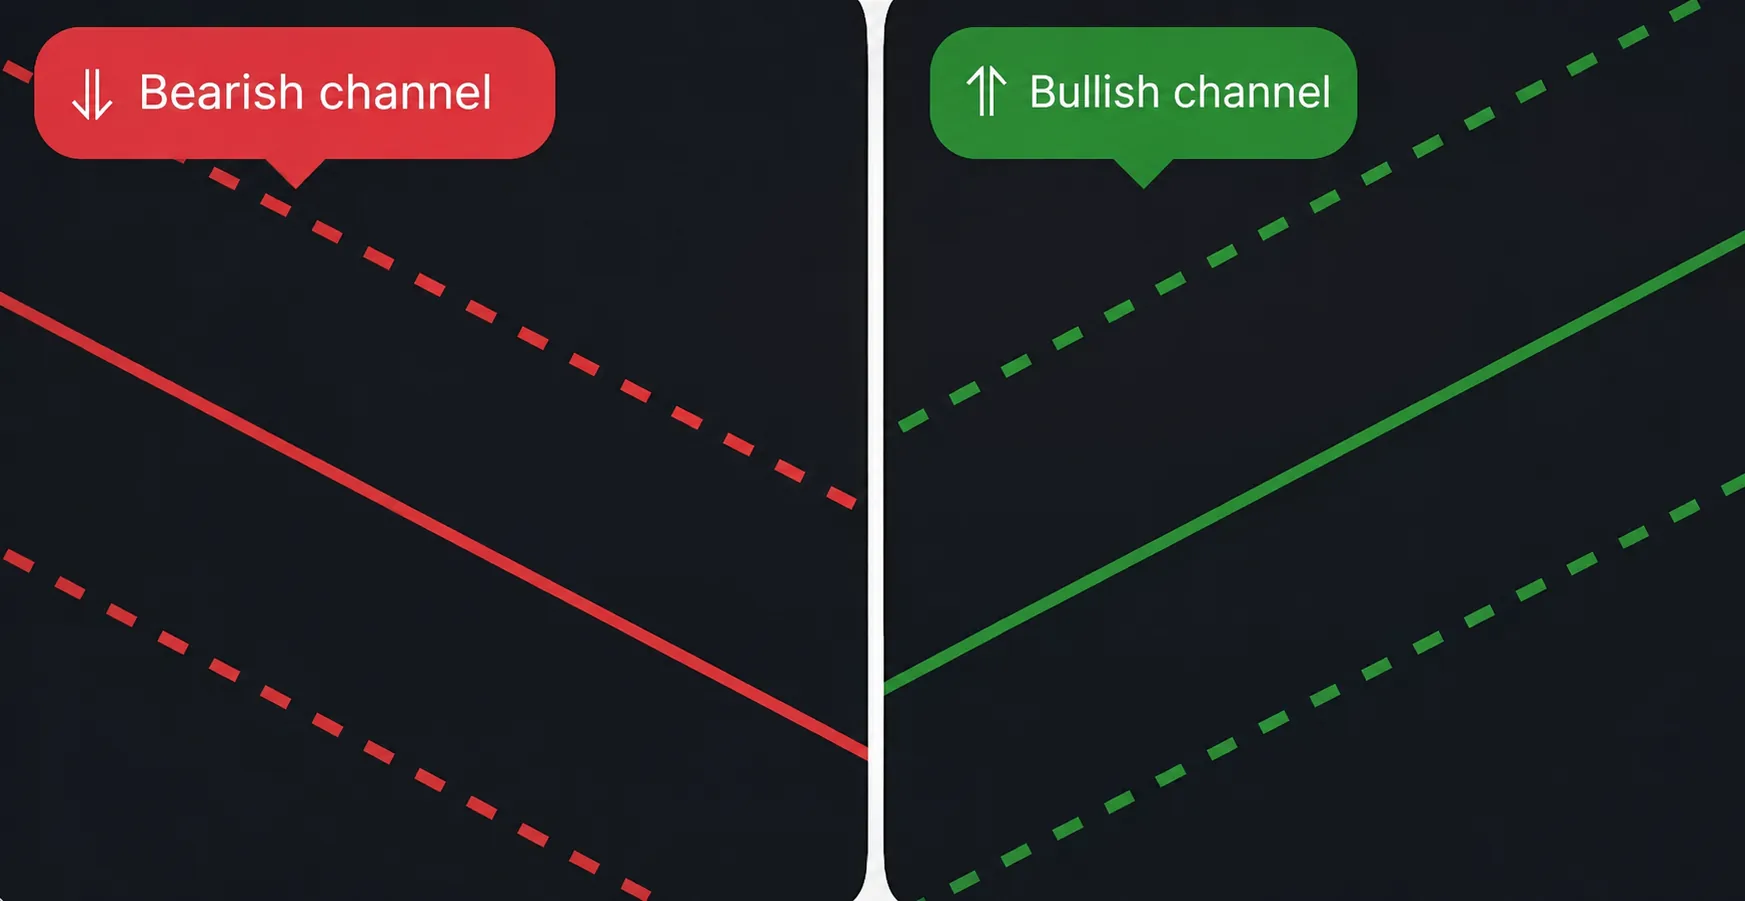 Use the Midas Up TradingView Price Channel IndicatorThe price channel gives a moving frame for price location. Its boundaries are analytical zones, not guaranteed reversal points.Open guide: Use the Midas Up TradingView Price Channel Indicator
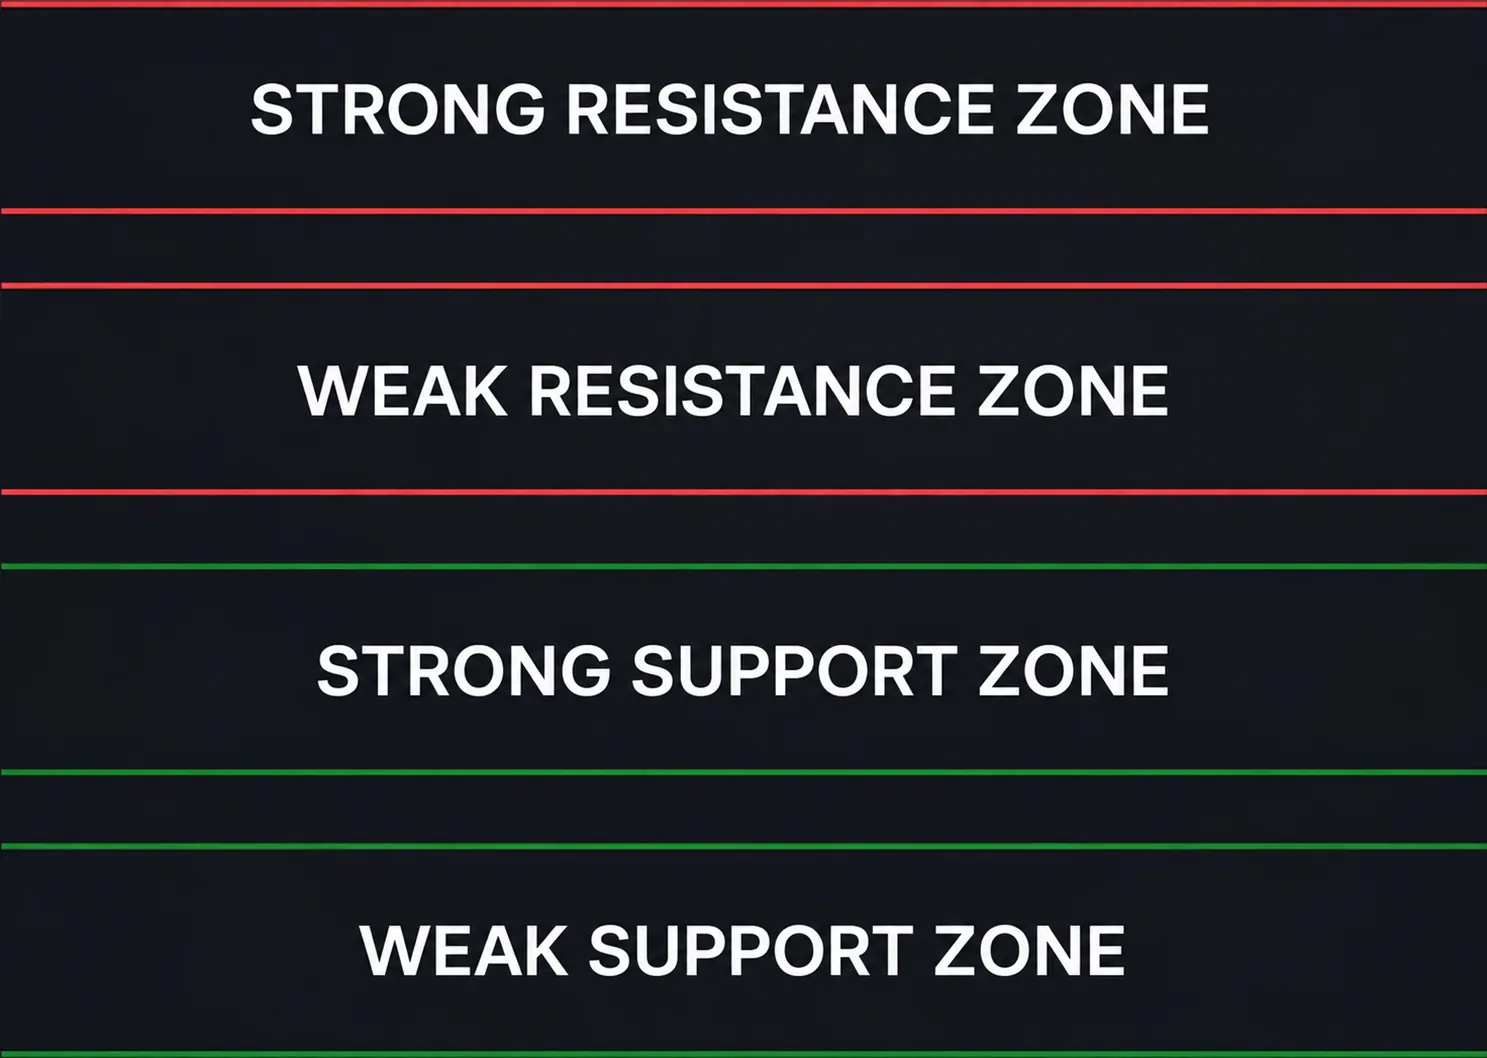 Read the Midas Support and Resistance IndicatorHorizontal levels organise prior reaction areas. They should be treated as zones for observation rather than exact guaranteed prices.Open guide: Read the Midas Support and Resistance Indicator
 Read the Horizontal Volume Profile Indicator in Midas UpThe profile shows how the available volume data is distributed across price levels, adding a volume-by-price layer to the chart.Open guide: Read the Horizontal Volume Profile Indicator in Midas Up
 Read the Midas Up TradingView Liquidity Heatmap IndicatorThe heatmap highlights chart areas where liquidity may be relevant. It is an analytical model, not a view of every market participant’s orders.Open guide: Read the Midas Up TradingView Liquidity Heatmap Indicator
 Read Midas Candlestick Signal Hints, Pressure and DivergenceCandle hints call attention to selected conditions around a bar. Their meaning depends on the surrounding trend, level and volume context.Open guide: Read Midas Candlestick Signal Hints, Pressure and Divergence
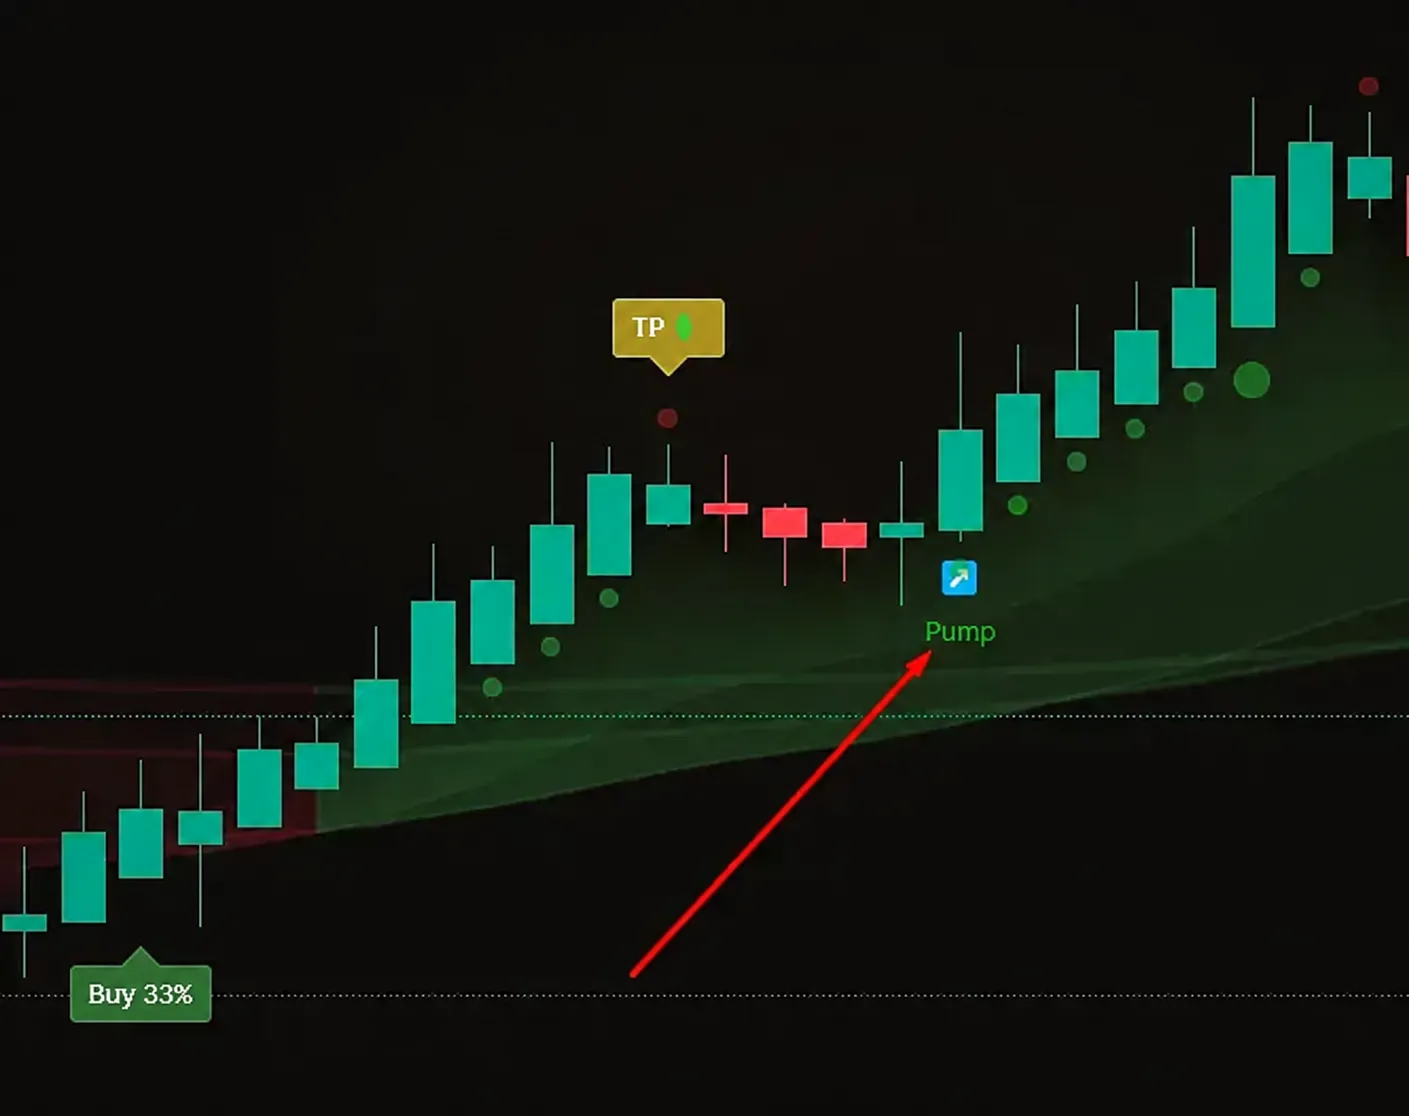 Read Midas Candlestick Signal Hints, Pressure and DivergenceCandle hints call attention to selected conditions around a bar. Their meaning depends on the surrounding trend, level and volume context.Open guide: Read Midas Candlestick Signal Hints, Pressure and Divergence
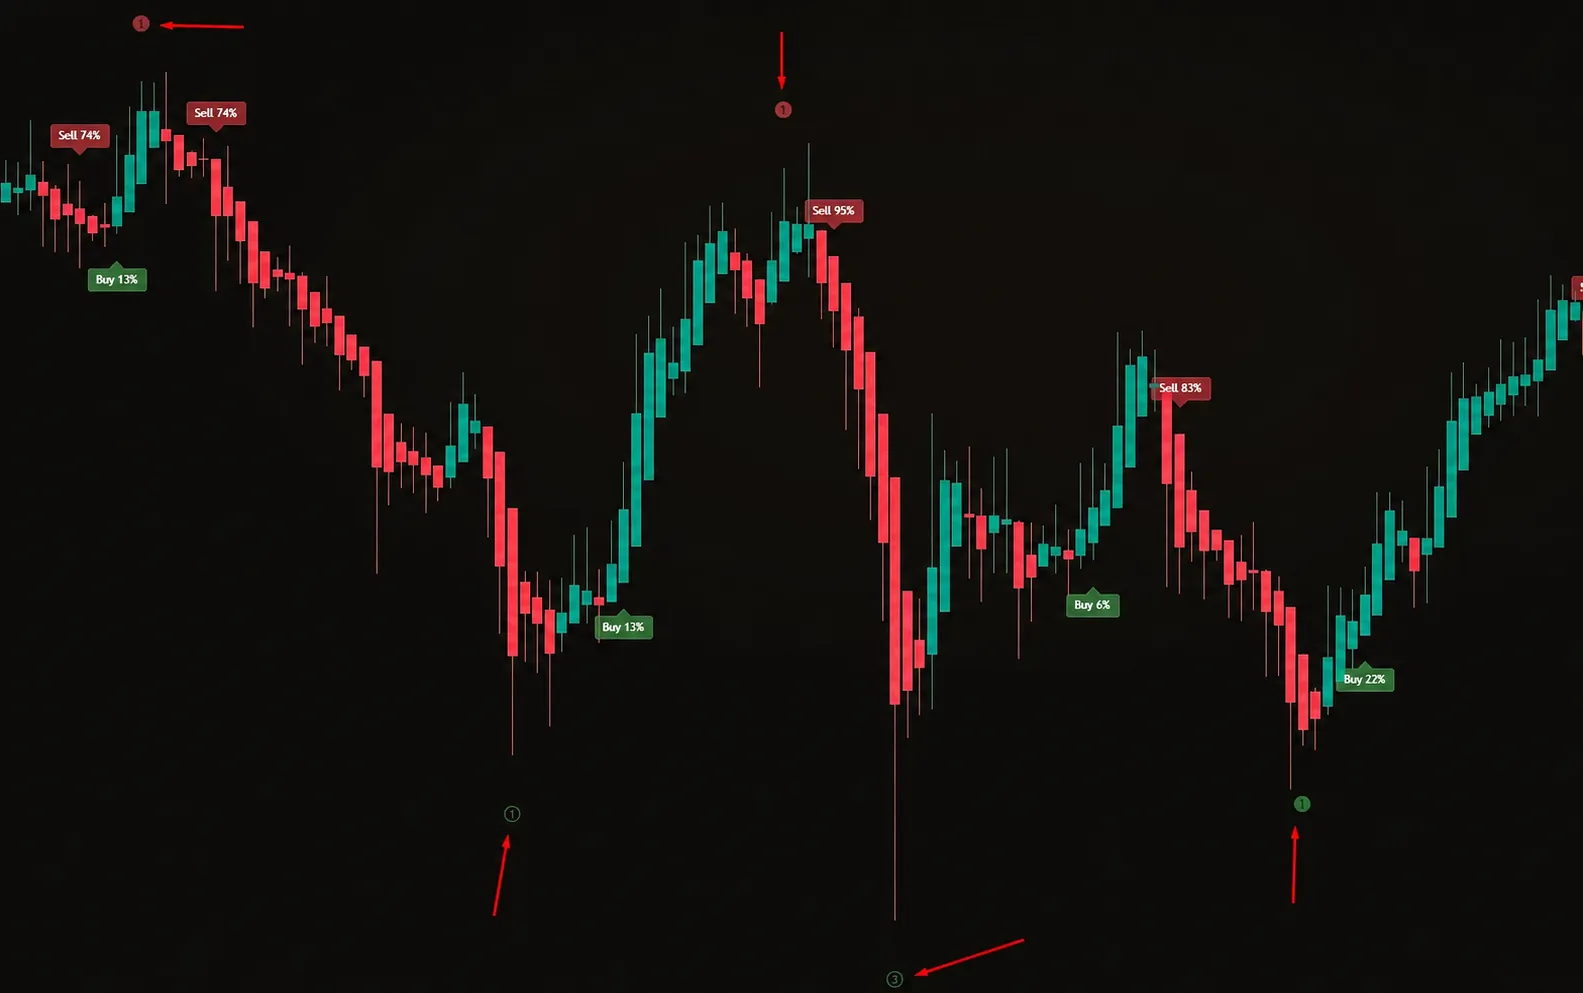 Read Midas Candlestick Signal Hints, Pressure and DivergenceCandle hints call attention to selected conditions around a bar. Their meaning depends on the surrounding trend, level and volume context.Open guide: Read Midas Candlestick Signal Hints, Pressure and Divergence
Midas Down: lower indicator
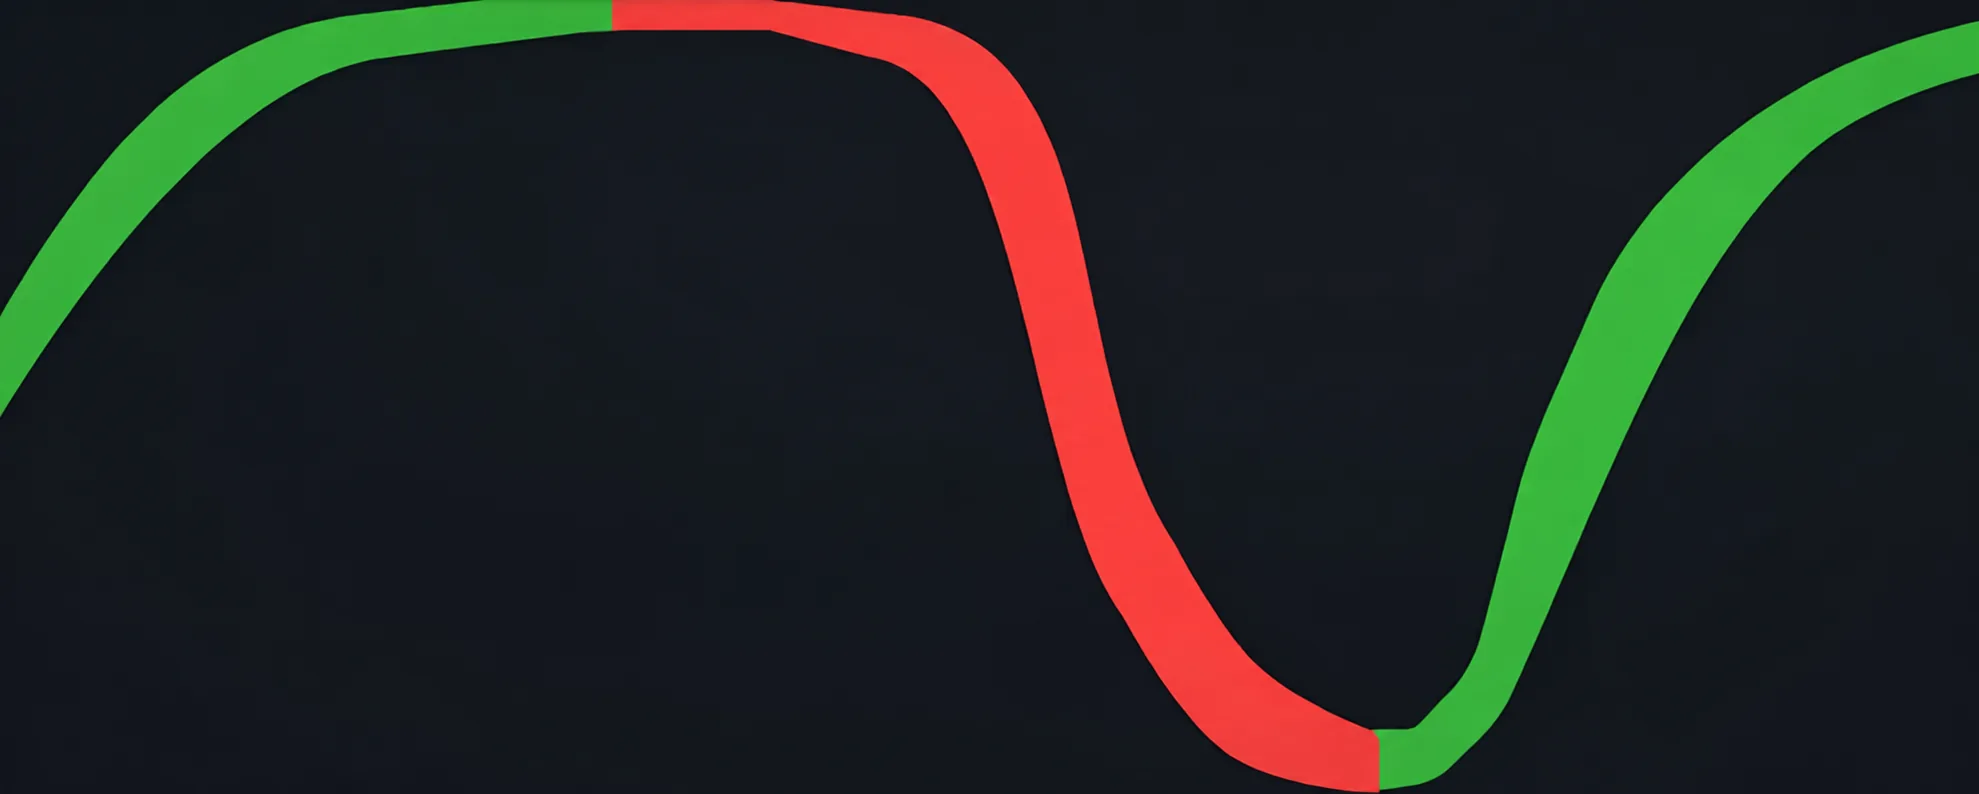 Read the Money Flow Indicator in Midas DownThe money-flow view summarises directional pressure from the available data and adds confirmation context below the price chart.Open guide: Read the Money Flow Indicator in Midas Down
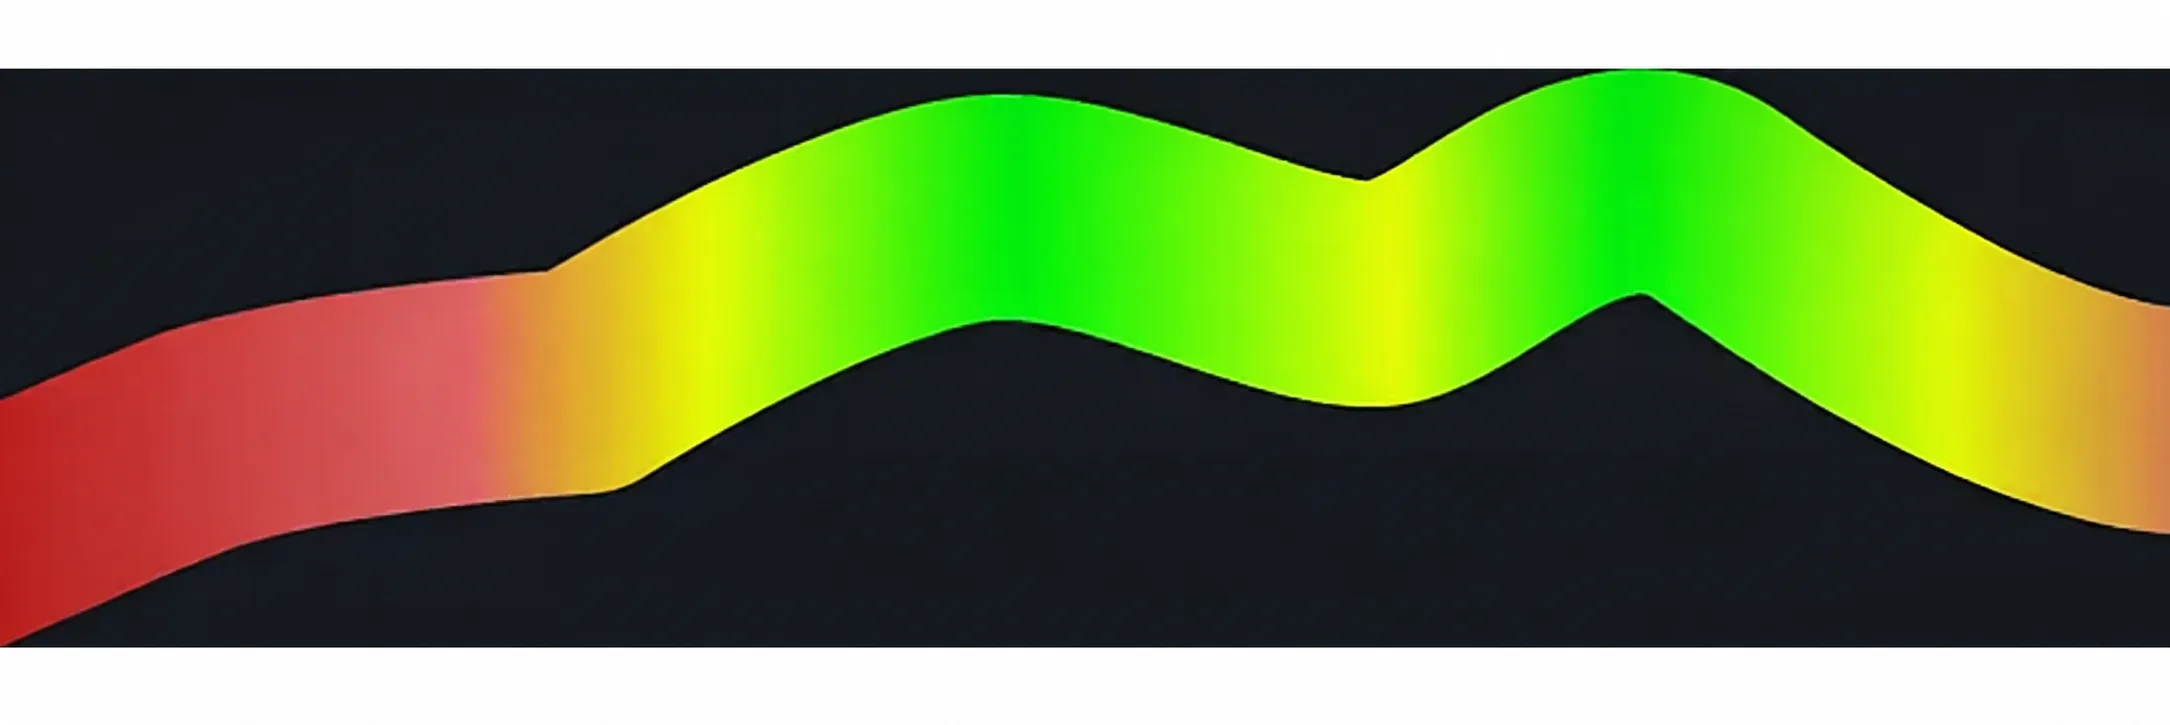 Use the Midas Down TradingView Trend Ribbon IndicatorThe trend ribbon helps visualise the direction and changing state of a market wave in the lower pane.Open guide: Use the Midas Down TradingView Trend Ribbon Indicator
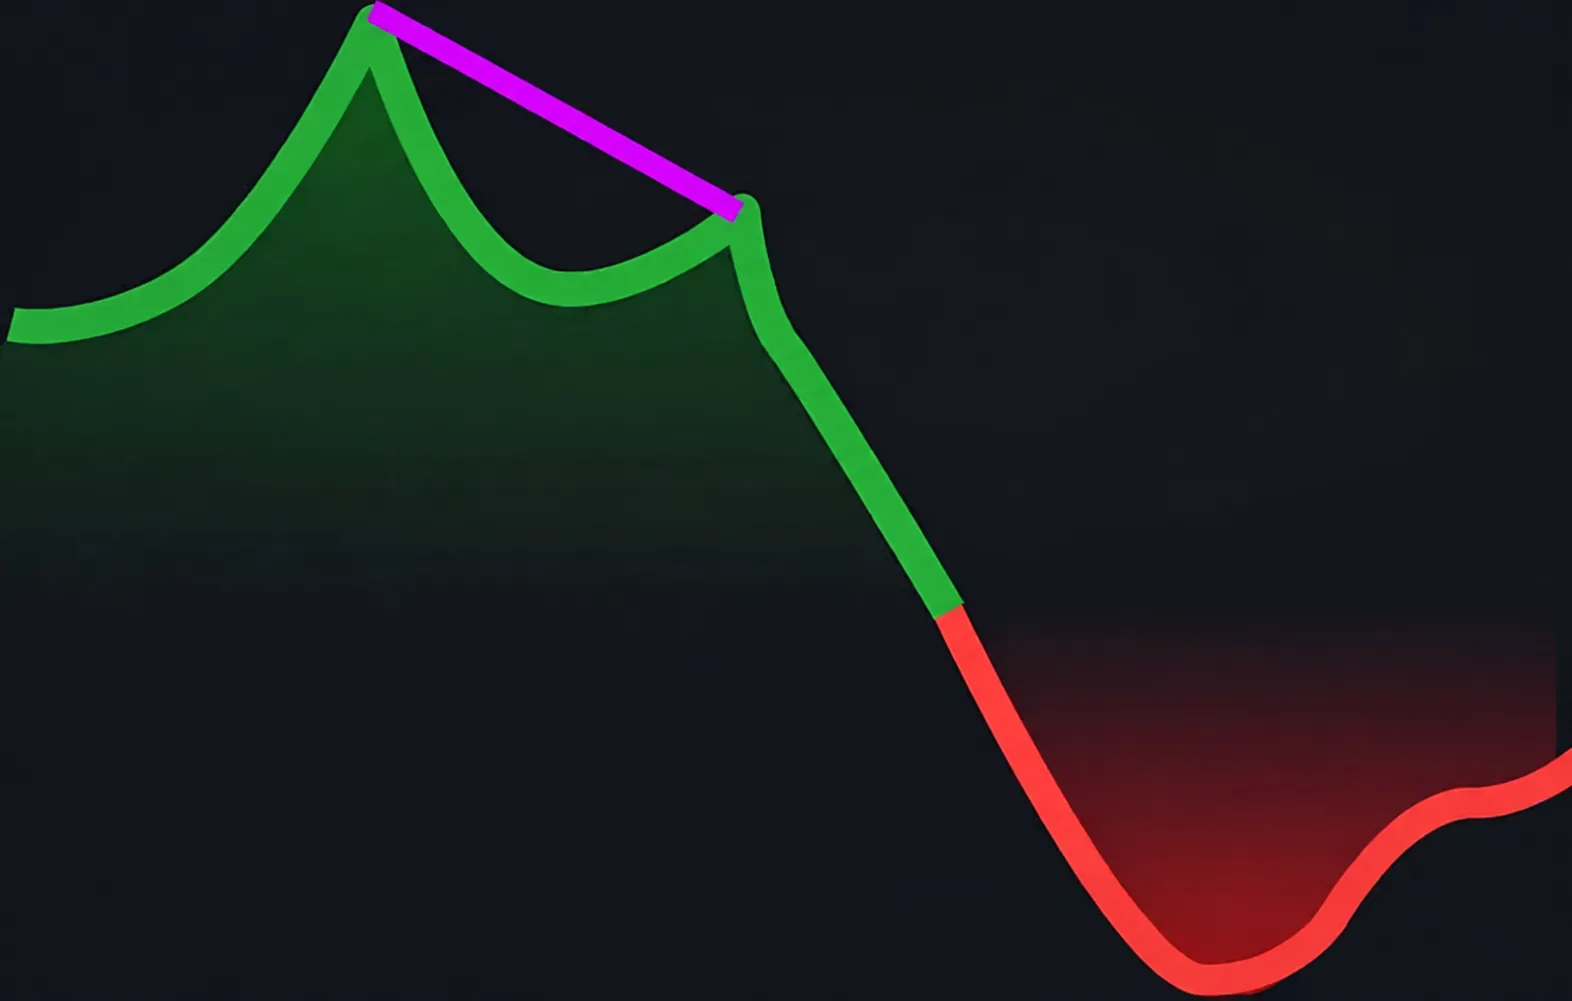 Read the Price Momentum Indicator and Wave QualityMomentum describes how the current move is developing. Strong momentum can continue or fade, so it is not a standalone timing rule.Open guide: Read the Price Momentum Indicator and Wave Quality
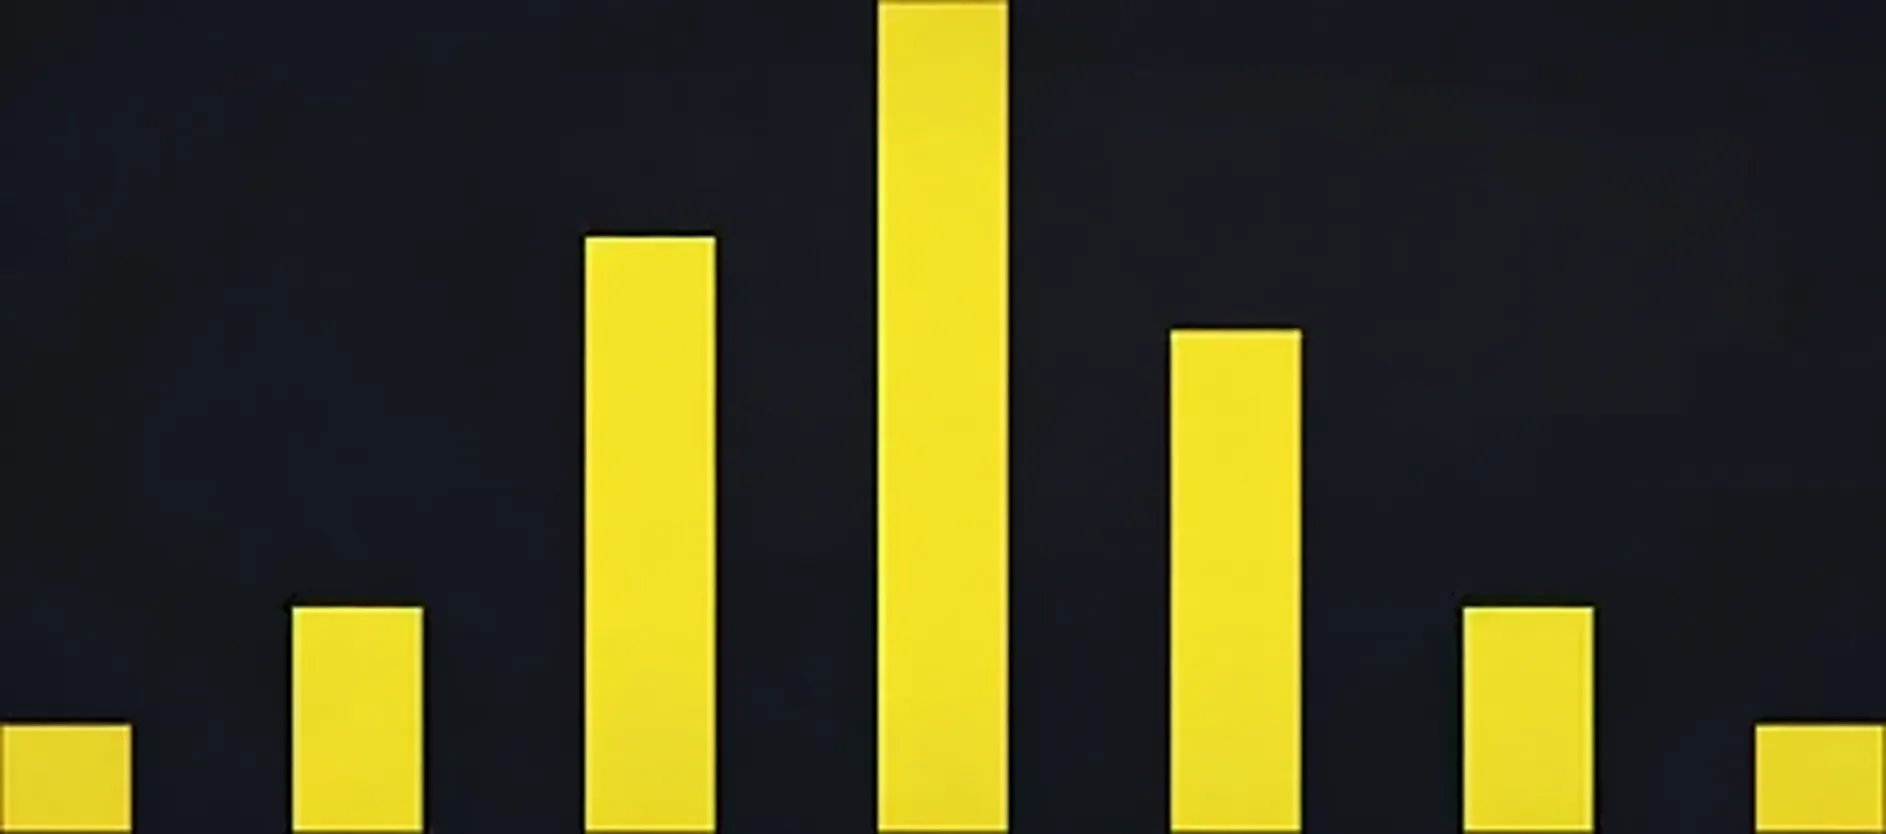 Read the Market Accumulation Distribution IndicatorThis tool labels indicator-defined market phases and impulse conditions. It does not identify a real person or prove who placed an order.Open guide: Read the Market Accumulation Distribution Indicator
 Read the Market Accumulation Distribution IndicatorThis tool labels indicator-defined market phases and impulse conditions. It does not identify a real person or prove who placed an order.Open guide: Read the Market Accumulation Distribution Indicator
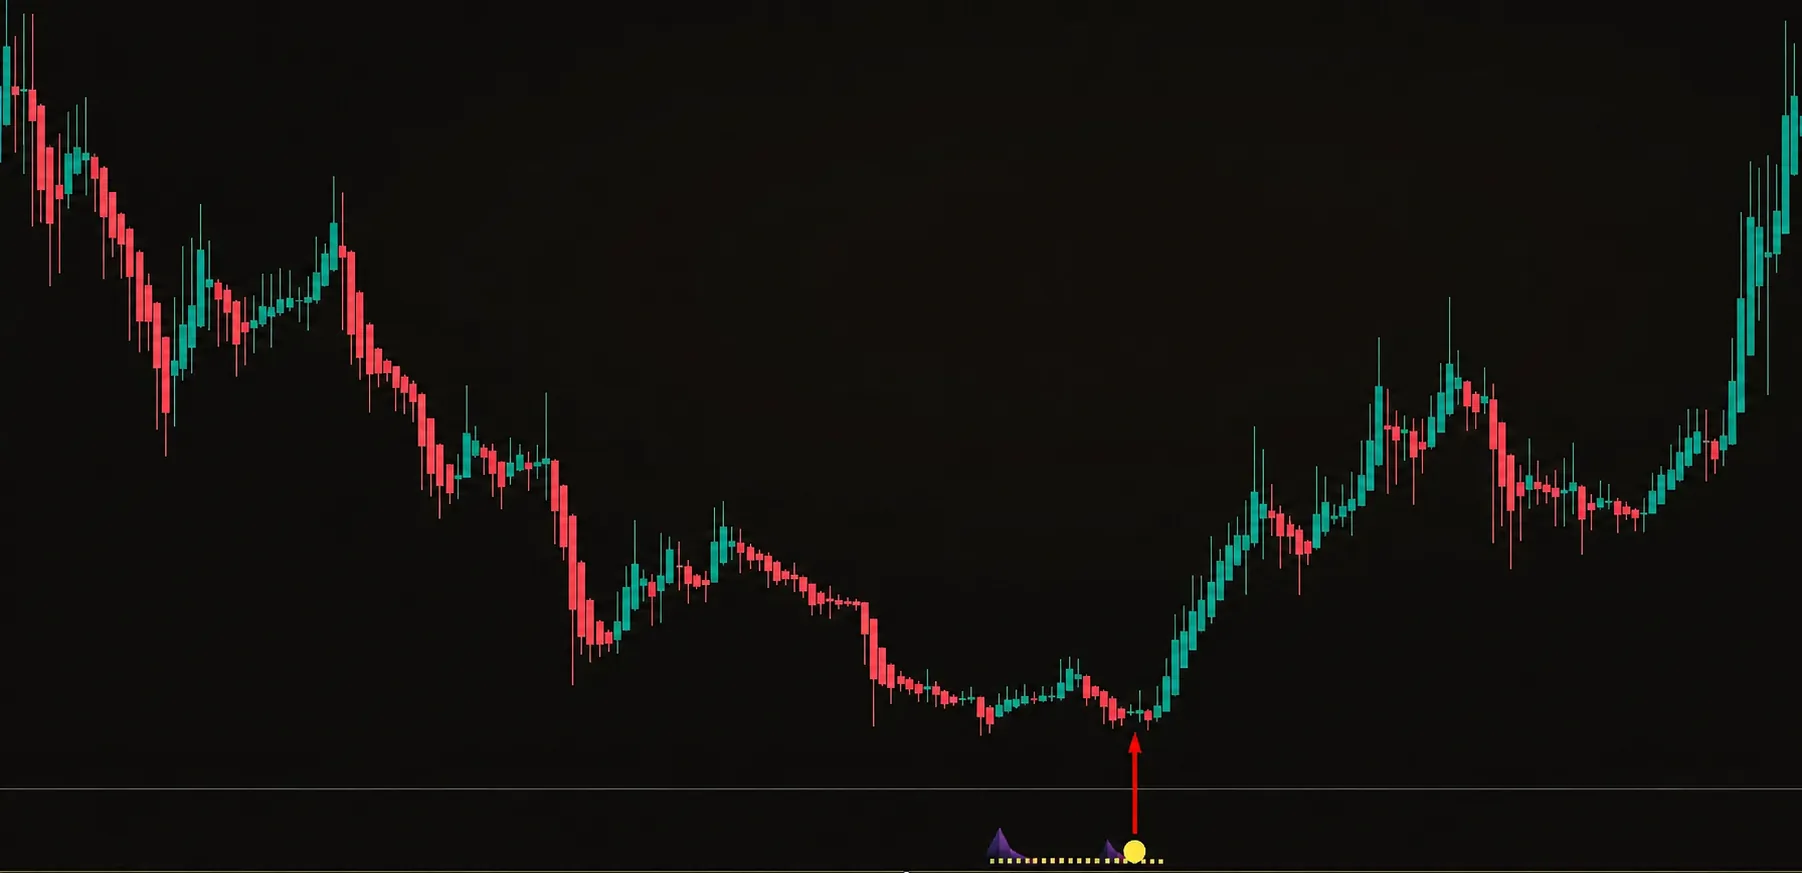 Read the Market Accumulation Distribution IndicatorThis tool labels indicator-defined market phases and impulse conditions. It does not identify a real person or prove who placed an order.Open guide: Read the Market Accumulation Distribution Indicator
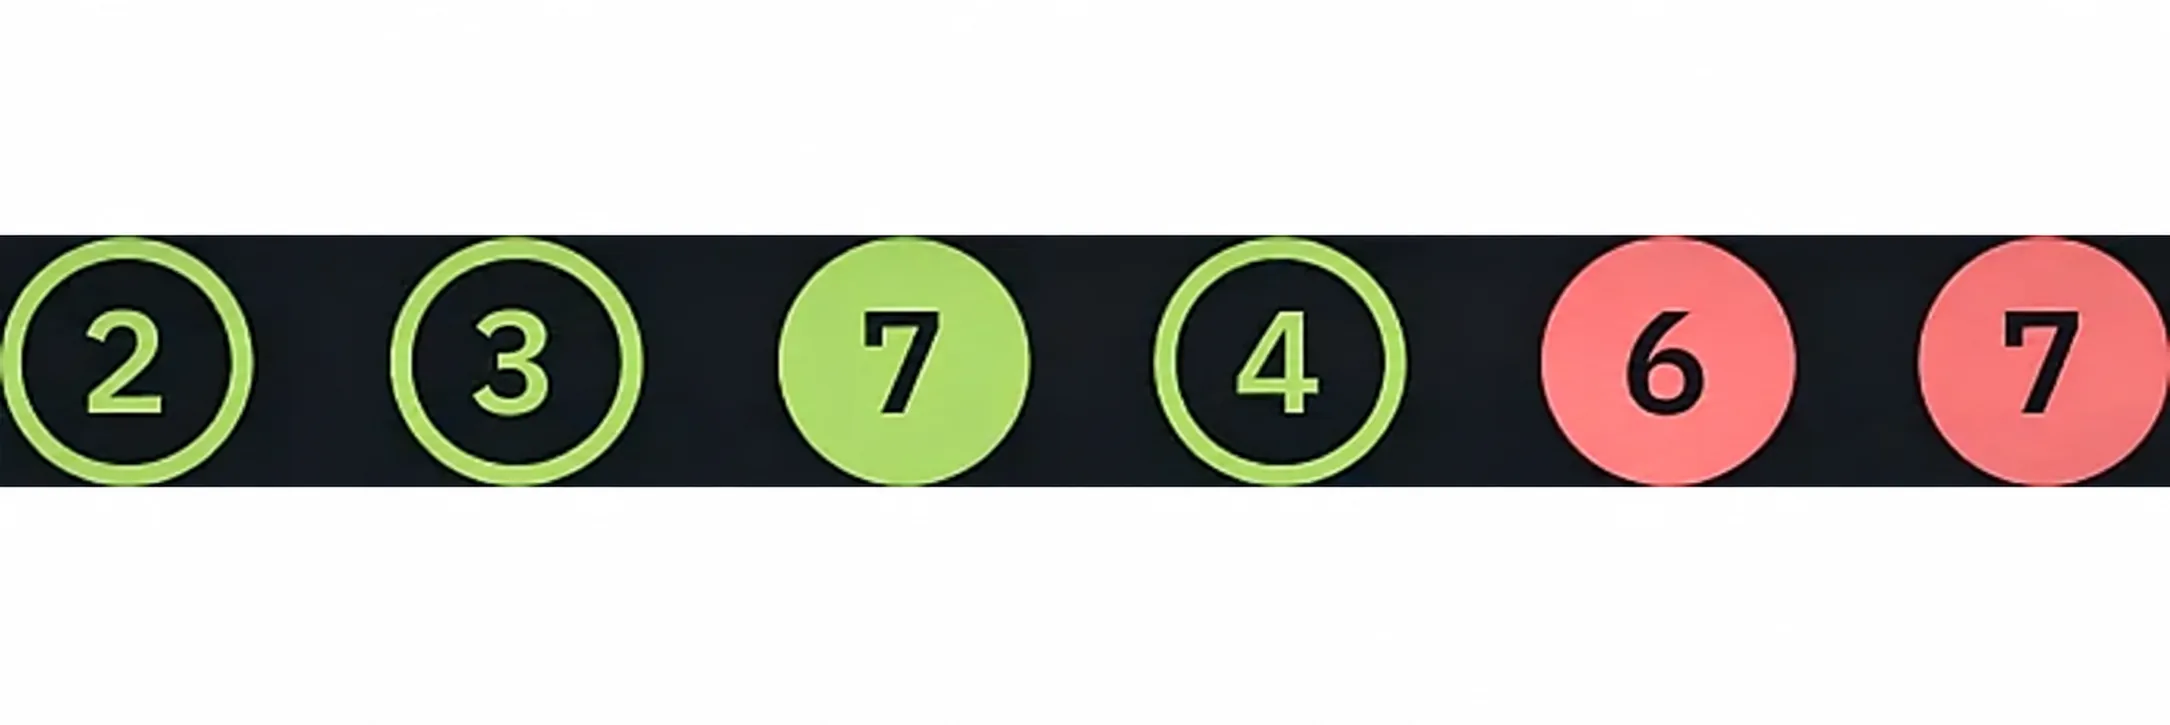 Read the Volume Delta Indicator Inside a CandleVolume delta adds a pressure view to the candle. Its reliability and meaning depend on the market data available for the symbol.Open guide: Read the Volume Delta Indicator Inside a Candle
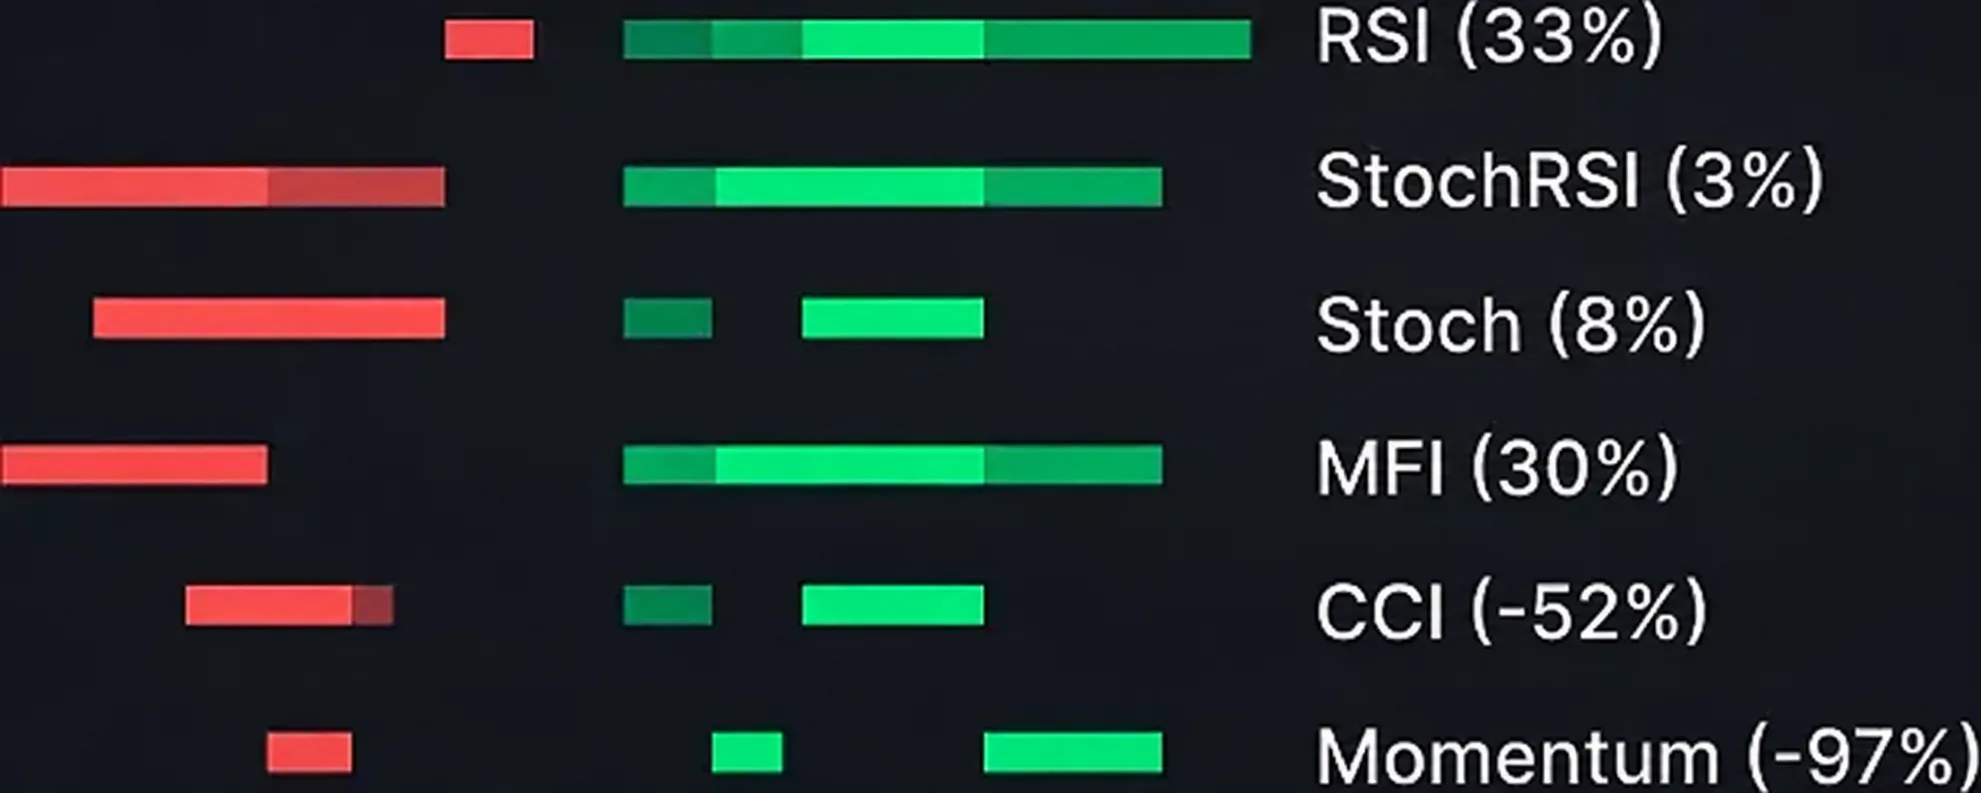 Read the Midas Overbought Oversold IndicatorThe scale summarises six oscillators into an overbought or oversold context. A stretched reading can persist during a strong trend.Open guide: Read the Midas Overbought Oversold Indicator
All Midas guides
Choose a setup, signal, indicator, ecosystem or troubleshooting guide.
No guide matched. Try another term or contact verified Midas support.
Quick start: 5 minutes
1How to Add an Invite-Only Indicator on TradingViewInvite-only scripts and an asterisk to your favorites - 3 clicks2How to Read Buy and Sell Signals in MidasBuy/Sell, stop loss, 3 goals and position projection3Use Setup Master AI Chart Analysis in MidasTwo-indicator logic, instant guidance and Setup Master analysis
Core setup: 15 minutes
4Choose Midas Strategy Presets for Your Trading StyleScalping, intraday, swing, investment - plus bounce and breakout5How to Choose TradingView Signal Filters in MidasRemove countertrend signals: channel, EMA, money flow, trend ribbon6Use the TradingView Indicator Auto Tester in MidasAutotester: honest statistics of your settings on history7Set Up Midas TradingView Alerts and Telegram DeliveryNotification paths: TradingView or Telegram
Indicator guides
Midas Up Indicator: Read Trend and Areas of InterestTrend and zones of interest: six tools, each has its own instructionsMidas Down Indicator: Confirm a Trading SetupEntry confirmation: six tools, each with its own guideUse the Multi Timeframe Trend Indicator in MidasTraffic light trends: local and global at once across all TFUse the Pump & Dump Pullback Indicator in MidasSeparate indicator: find a sharp impulse and enter the pullbackUse the TradingView Strategy Backtester in MidasBot strategy in TradingView: a test of its logic on historyRead Trend with the EMA 20 50 100 200 Trend IndicatorEMAs 20, 50, 100 and 200: Global Trend Direction and Trend LevelsUse the Midas Up TradingView Price Channel IndicatorLocal trend and its boundaries: rebounds, central line, channel widthRead the Midas Support and Resistance IndicatorSupport and resistance with strength ratings: bounce, breakout, retestRead the Horizontal Volume Profile Indicator in Midas UpTrade shelves and POC: where the big players gained positionsRead the Midas Up TradingView Liquidity Heatmap IndicatorClusters of other people's stops: where the price pulls a magnet and where to put your ownRead Midas Candlestick Signal Hints, Pressure and DivergenceMarket pressure, Pump and Dump, candle divergence counterRead the Money Flow Indicator in Midas DownGlobal movement of money in the asset: the bottom and peak of the market, the change in trendUse the Midas Down TradingView Trend Ribbon IndicatorBeginning and end of wave: changing the color of the ribbon as the moment of reversalRead the Price Momentum Indicator and Wave QualityStrength and quality of the wave, reversal points and position finishing zonesRead the Market Accumulation Distribution IndicatorAccumulation and distribution phases, large impulse trades, pumps and dumpsRead the Volume Delta Indicator Inside a CandleWho won inside the candle and how strong the edge wasRead the Midas Overbought Oversold IndicatorSix oscillators in one strip: overheating in favor of buyers or sellers
Midas ecosystem
Use the Midas TradingView Market ScreenerContinuous monitoring of 1,000+ assets and the flow of ready-made situationsWhat the Midas VIP Club IsClosed chat, debriefing of setups and lessons - in any paid tariffHow BingX Cashback Through Midas WorksThree ways to link BingX and get a commission refundMidas Trading Education: Where to StartThree levels: Base, strategy course and personal program
Try the workflow on your own chartThe seven-day demo contains exactly Midas Up and Midas Down.
Start the free 7-day demoNo card. No payment. A TradingView username is public; never send a password.
8,400+ Midas indicator installations · 300+ client reviews · active since 2024

