
The arrow has appeared, but it is unclear whether it is an entry command, a hint, or already too late.
The signal reads like “Buy Now.”
You enter without a zone or confirmation, place the stop at random, and price moves the other way.
The signal is part of the chart context
Each element is clear - the arrow, targets and stop - so you know when to act and when to wait.
A Buy or Sell arrow is a reason to open the chart and assess the situation, not a command to enter: the indicator is not a bot and does not open trades for you. It marks the start of a new price wave and provides four reference points: direction, a volatility-based stop-loss, three liquidity-based targets and a position projection with a risk-to-reward estimate.
You don't have to go into every signal in a row: more than 70% of the time, the market is sideways, and the signal saves hours on the monitor, but it doesn't replace your analysis and it doesn't guarantee profits.
Updated: · Midas Team
How Buy and Sell signals work
The main problem with most traders is that they don’t have quality signals: people either sit at the chart for hours or drown in noise and don’t understand which signals are worth paying attention to and which ones will only multiply losses.
Midas takes a different approach: it helps adapt signals to your trading style, remove unnecessary noise and notify you only when the market provides a genuine reason to open the chart and make a decision. Instead of scanning dozens of assets chaotically, you follow a system.
Midas signals are not intended for blind entries.
- Show the possible start of a move in time;
- highlight the moment of rebound from the level;
- Reduce the need to watch the chart constantly;
- Provide a basis for analysis of your strategy.
Signals appear at the start of a wave and do not repaint
Signals appear with a slight delay and show the beginning of an upward or downward move. The goal is not to predict a reversal, but to notice a new wave in time. The delay can be adjusted for earlier signals or fewer, cleaner signals.
To see how the indicator works, clear the "Show only the last signal" checkbox in the settings. All historical signals will appear on the chart. Once a candle closes, its signal is fixed and no longer moves, so you can review the history for recurring patterns.
What each chart marker shows
The indicator calculates the position for you; compare it with your own strategy. Open a tab below to see what each element means.
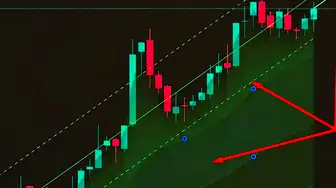
After a signal, the indicator draws a position rectangle: the risk zone and stop below, the profit zone and targets above, and the risk-to-reward ratio at the side. Peak profit for the current trade is shown above the chart.
Be sure to analyze the chart by the indicator to make your adjustments to the position or miss the signal if it does not fit your strategy.
A Buy signal marks a new upward wave and a potential long trade, but it is not an entry by itself. Open the chart, review market structure and check the setup against your strategy.
It signals the beginning of a down wave and a potential short trade, and the logic is the same: the signal shows the opportunity, and the decision is yours.
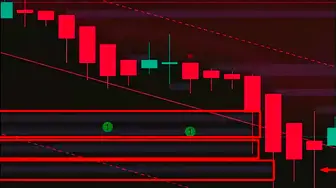
The stop is placed with a small margin based on current volatility, so a random move is less likely to close the position: below the current candle's low for Buy signals and above the current candle's high for Sell signals.
By default, the stops are short so you don't have to sit through deep drawdowns. Size changes: in the advanced settings, there's SL in percent -- put your value under your strategy, like 200%, to double the stop.
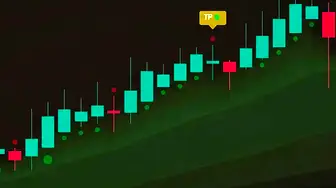
The indicator identifies the nearest liquidity areas that may attract price. The three nearest clusters in the signal direction become targets, calculated separately for each signal rather than from a fixed formula.
If the chart does not show liquidity, targets are calculated from stop size: target 1 at 1:1 risk-to-reward, target 2 at 1:2 and target 3 at 1:3. These are indicator suggestions; you decide where to take profit.
- Close the trade based on the current situation, including news or market manipulation that the indicator could not have anticipated at entry.
- Follow your strategy: scalping, intraday, swing or investing; one take-profit target or several; a trailing stop or grid orders.
Show directly on the chart where targets were reached and send a notification to TradingView and Telegram.
Protect capital when using signals
Don't go blind on the signals.
It's just a price-movement notification. For more than 70 percent of the time, the market is sideways trading, so you don't have to sit in front of the monitor for hours, but you start analyzing at the right moment.
Open trades only after analysing the chart
Use your trading strategy and do not deviate from it: confirm the entry by all factors at once - trend, levels, liquidity, volumes.
Test your strategy on history.
Review how the indicator performed on your asset and timeframe in the past, then choose the settings. Auto Tester provides full statistics for them; this is step 6 of the route.
Manage risk and use stop-losses.
After testing, start with small amounts and be sure to use stops - this is the only way to protect your deposit.
Adapt signals to your trading style
The frequency and speed of signals are a setup, not a given, and the indicator settings have a "Strategy and Signal Number" item: scalping gives dozens of signals per day, investing several per month, intraday is the default and is suitable for most.
This addresses two common problems: too many signals that overwhelm you, or too few signals that make the market seem inactive. Step 4 explains all strategies, style-specific settings, trade examples and Up/Down synchronisation.
In the same place, in the extended settings, the stop size changes - the item "Size SL in %".
Signal questions
Is the signal a deal?
No way. The signal is the signal that the price is starting to move and the reason to open the chart, and then the indicator gives you a full set of tools to analyze, but you make the decision.
What if one timeframe Buy and another Sell?
Use signals from your entry timeframe. Higher timeframes provide context, but their individual Buy or Sell signals are not entry commands for the lower timeframe.
Signals naturally differ across timeframes because each one reflects the current wave at its own scale; this is the fractal nature of price charts.
How much will I earn – what percentage per year?
There is no such promise. You can enable Auto Tester to review the potential of historical trades, but the real outcome depends on your decisions. Without risk management, the first trade can still cause a serious loss.
The indicator is not a grail and does not make decisions for you - it helps you analyse the chart and notifies you when a move begins.
What is the signal win rate?
The built-in tester averages 50-55% when entering every signal in sequence without selection. With settings matched to a specific asset and timeframe, it has reached up to 70%. Past results do not guarantee future results.
What matters is what that figure measures: the proportion of signals that are not closed by stop loss, which is used to compare settings among themselves and match the best ones for your market, not to predict earnings.
Midas is not a robot: a live trader doesn't go in all the signals in a row, so your statistics will be theirs. And the winrate itself does not equal profit: 54% with a risk-reward ratio of 1 to 2 work in a plus, and 70% with poor risk management give a minus.
Do you need signals for automatic trading?
You get a signal and you decide whether to open a position, based on your technical analysis and your strategy.
How many signals does the indicator give?
Depending on your strategy and timeframe, from one notification per week to hundreds per hour, the frequency is completely in your hands.
What signals can and cannot tell you
Midas is a technical analysis and training tool, not a financial advisor or a trading robot. Signals, targets and stops are chart markup and guidance, not a personalised buy or sell recommendation.
Historical results do not guarantee the same outcome in the future: the market changes, and each trade depends on your strategy, discipline and risk management. Trading involves the risk of losing funds - use only money you can afford to lose.
Did this guide help?
Thank you. Your answer was recorded.
Thank you for your feedback. You can continue in the English-language Midas bot. Open the English bot
Test Midas on your own TradingView chart
- Seven days free: Midas Up and Midas Down on your TradingView chart
- No card or prepayment: access is linked to one public TradingView username
- Markets available on TradingView and timeframes from one minute to one month; choose settings for the asset and trading style
No card. No payment. A TradingView username is public; never send a password.
8,400+ Midas indicator installations · 300+ client reviews · active since 2024

