
Changing indicator settings by eye is an expensive trading habit: the hypothesis is tested with real trades, and the account pays for every mistake.
Without Auto Tester
You spend hours scrolling charts and still cannot tell whether the settings perform better or merely look better, so you end up testing them with real money.
With Auto Tester
A table shows how your settings performed over a month or year: signal count, stops and potential. Testing a hypothesis takes minutes.
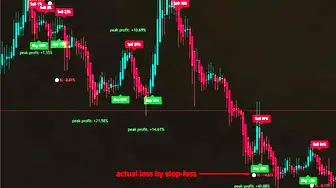
Auto Tester is a mode that hides the indicators and displays a table of historical results for past signals: the number of Buy and Sell signals, how many trades closed at stop-loss, the resulting win rate and the movement potential shown by signals during the period.
Auto Tester evaluates your actual settings rather than an abstract example: the selected strategy, filter, asset and timeframe. Enable it from the indicator settings by opening the gear next to the name and choosing the top item, Indicator operating mode. The statistics include every loss from a triggered stop, so this is a tool for comparing configurations, not a promise of future returns.
Updated: · Midas Team
How to enable Auto Tester
Open the indicator settings
Use the gear ⚙️ next to Midas Up on the chart.
Select Autotester mode.
The mode list is the top of the settings, and the indicators will be removed from the chart, and the statistics table will appear instead.
item "Indicator mode" and list of modes
How Auto Tester works
There are no holy-grail claims: the mode shows the historical performance of your strategy, including every loss from a triggered stop rather than only successful trades.
Midas signals do not repaint after a candle closes, so the table reflects what was actually visible on the chart at the time.
What the results table shows
- Signals - the total number of Buy and Sell signals during the period.
- SL - How many deals have closed by stop loss.
- Win Rate - the percentage of trades that did not close at stop-loss.
- Income - peak profit of successful transactions (on the chart it is green interest).
- Loss - the amount of losses on transactions closed by the stop (red interest).
- Total - the combined potential of the settings: peak profit minus losses from triggered stops.
- The average transaction is the average potential movement on one transaction, taking into account stops.
The chart also shows percentages for each trade: green values show peak profit for signals that did not hit the stop, while red values show trades closed at stop-loss. The example appears at the top of this page.
When to use each mode
Autotester is not needed to enter the here and now, but to test the hypothesis on numbers - before you carry it into working mode with signals and alerts.
- Check out a new strategy before trading it.
- Compare two options and choose the one that performed more consistently on historical data.
- Choose preset for a specific asset and timeframe.
- It makes sense to work with this combination of parameters.
Test one parameter at a time
Set the asset, timeframe and settings, look at the statistics - and change one important parameter, comparing the result with the previous run.
If you spin it all at once, you don't know what made it better, and you get the illusion of quality instead of working on the setup, and you find a combination that works -- go back to work, check it with your eyes on the chart, and then plug in the alerts.
Auto Tester questions
What is the win-rate of Midas?
The chart shows statistics for your settings, including stop-losses and peak trade potential. Across all signals without selection, the built-in tester averages 50-55%. With settings selected for a specific asset and timeframe, it has shown up to 70%. Past results do not guarantee future results.
The real win-rate depends only on your strategy and experience: where you record profits, what signals you go to and what you miss.
What exactly does Autotester show?
A chart of past signals from your current settings, and the indicators themselves are hidden in this mode, so you can look at the test result, not at the overloaded graph.
For what period are statistics available?
Statistics can be looked at over the past week, month, and year – depending on whether you’re testing a fresh hypothesis or the behavior of settings on a long history.
What is the income from profitable transactions?
We count peak profit: Midas does not trade for you, but shows the potential of signals on selected settings so that you can quickly compare strategies and filters with each other.
Don't think of statistics as a trading bot: you decide what signals to enter, how to trade and when to record profits.
Can you tell us the exact future of the win-rate?
No. The real outcome depends not only on the signal, but also on how you accompany the trade: profit-taking, stops, discipline. The tester compares the settings with each other, it doesn't predict the future.
How much will I earn – what percentage per year?
No indicator will give you that number. You can look at the potential of past trades, but the real profit depends on you: without risk management, you can lose your deposit on the first trade.
Midas is not a holy grail and does not make decisions for you; it helps you analyse the chart and notifies you when a move begins.
Why can’t you set up an exact closing for the test?
The indicator accurately shows the levels to enter and the immediate areas of interest as the target, but it cannot predict future circumstances: news, manipulation, economic and political changes.
Exit rules depend heavily on your choices: how many take-profit targets to use, how much to close at each, whether to enable a trailing stop, and whether to move the stop to break-even. These choices cannot be built into the indicator as one fixed rule; you monitor the trade yourself using the lower indicator.
Why can’t you make a trading bot from an indicator?
Midas combines analysis tools in one interface; it is not a black box that trades your money. Buy and Sell signals are not stand-alone entry commands. They reduce the need to watch charts for hours.
The indicator is a hand trading tool and your advisor.
What to do after finding a good setting?
Return to working mode, verify the selected parameters on the chart, make sure the signal logic is clear, and only then configure TradingView or Telegram alerts in step 7.
Did this guide help?
Thank you. Your answer was recorded.
Thank you for your feedback. You can continue in the English-language Midas bot. Open the English bot
Test Midas on your own TradingView chart
- Seven days free: Midas Up and Midas Down on your TradingView chart
- No card or prepayment: access is linked to one public TradingView username
- Markets available on TradingView and timeframes from one minute to one month; choose settings for the asset and trading style
No card. No payment. A TradingView username is public; never send a password.
8,400+ Midas indicator installations · 300+ client reviews · active since 2024

