
Hand-drawn levels are subjective: every trader marks them differently, and price ignores many of those lines.
Random point lines
Price may ignore random lines, but stop-losses can still accumulate behind them and be triggered.
Levels from the indicator
Strong and weak zones are marked automatically; broken levels disappear, leaving only active levels on the chart.
The indicator automatically marks meaningful levels and removes human subjectivity: green levels are support that can prevent price from falling, while red levels are resistance that can prevent price from rising. It also rates their strength: a weak level has produced one reversal, while a strong level has held twice or more and is therefore more significant.
Price often moves from one level to another, creating clear areas for entries and profit-taking. In a weak trend or sideways market, trade bounces; in a strong trend, trade a breakout followed by a retest. Open from strong levels, not directly into them, and consider taking profit as price approaches the next strong level.
Updated: · Midas Team
How automatic levels appear on the chart
The indicator itself highlights all the significant levels, excludes human subjectivity and even shows the strength of the level - so you quickly understand which areas are key to the price:
- Green levels are support that prevents the price from falling.
- Red levels are resistance that prevents the price from rising higher.
- Weak levels are areas where the price is only deployed once; they do not always work.
- Strong levels are areas where the price has been held back and reversed twice or more; they act as key support and resistance.
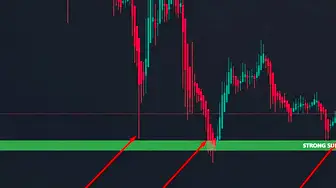
The example of the daily chart shows how a strong level of support restrains the price many times, preventing it from falling lower, and each time the price makes a good rebound, reaching this level.
Knowing this level could have helped take profit on short positions and consider long positions after support held.
Weak support is when a price movement has formed a level but has not yet been confirmed by a rebound and is therefore considered “weak”.
Here, the price drop often slows down, there may be a rebound, but the chances of a reversal are lower than that of a strong support level.
The daily chart for the last four years shows how a strong resistance level restrains the price for years and breaks the uptrend into a downtrend as soon as the price reaches this resistance.
Knowing this level could have helped take profit on long positions and consider short positions after resistance held.
Weak resistance is when the price movement has formed a level, but it has not yet been confirmed by a rebound and is therefore considered “weak”.
Here, the price rise often slows down, there may be a rebound, but the chances of a reversal are lower than that of a strong resistance level.
How to use support and resistance levels
Price often moves from one level to another, and correctly identifying levels helps you see important market areas and find better entries and profit-taking points:
- When price reaches a level, watch where the candle closes: above it supports a bullish scenario; below it supports a bearish scenario.
- Open positions from strong levels, not directly into them.
- Consider taking profit as price approaches a strong level.
The daily-chart example shows how effectively the strong level produced repeated rebounds without additional factors.
The same chart had a resistance level all along: when it was reached, the price not only bounced back, but also turned around and went back to the support level.
Bounce and breakout: two level scenarios
Trading from levels is one of the most popular strategies in trading, which is ideal even for novice traders due to clear entry points, stops and goals:
- Bounce trading: in a weak trend or sideways market, find the strongest levels likely to produce a reaction, wait for the bounce to begin, and trade in its direction.
- Breakout trading: in a strong trend, wait for price to break the level and then retest it from the other side before trading in the breakout direction.
A level-trading workflow for beginners
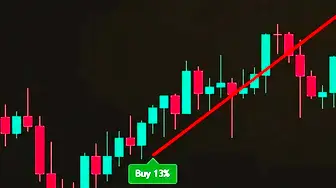
Use signals together with horizontal support and resistance: when price bounces from support, wait for a Buy signal and open a long; when price bounces from resistance, wait for a Sell signal and open a short.
- It works best in the trend direction and in sideways markets on higher timeframes.
- Against the trend, consider only small bounces with short targets.
- Experienced traders can open trades earlier without waiting for the signal.
Advanced confirmation around a level
We use horizontal support and resistance levels along with the price channel, moving EMA, horizontal volumes and the heat map of liquidity:
- You do not need to wait for the coincidence of all factors - only 2-3 are enough.
- The more coincidences, the higher the chance of working out the signal.
- It works best in the current trend direction and in sideways markets.
Level matching
We look for strong horizontal levels on the chart, which coincide with the boundaries of the price channel and horizontal volume shelves.
Confirmation
Confirm the level with a nearby EMA or an accumulation of liquidity from stop orders.
Signal entrance
When the price approaches an important support area, wait for the Buy signal and open the long; when it approaches an important resistance zone, wait for the Sell signal and open the short.
Did this guide help?
Thank you. Your answer was recorded.
Thank you for your feedback. You can continue in the English-language Midas bot. Open the English bot
Test Midas on your own TradingView chart
- Seven days free: Midas Up and Midas Down on your TradingView chart
- No card or prepayment: access is linked to one public TradingView username
- Markets available on TradingView and timeframes from one minute to one month; choose settings for the asset and trading style
No card. No payment. A TradingView username is public; never send a password.
8,400+ Midas indicator installations · 300+ client reviews · active since 2024

