
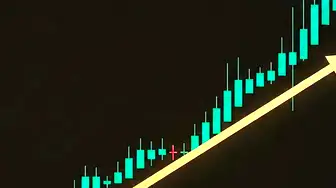
The wave has begun or is already ending - the two states cannot be distinguished by eye.
Entry near the end of a move
There's a couple of percent left, and the risk is the same as at the beginning.
Entry using the ribbon
The ribbon colours the wave, so you can see where the move starts and when it loses momentum.
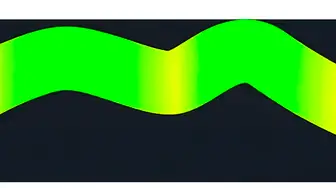
The trend ribbon shows price waves and smooths out market noise to highlight only meaningful reversals. It works in a very simple way: green ribbon is an upward wave, red is a downward wave, and a change in color at key points signals a possible reversal of price.
Start with the ribbon: it shows the short-term trend at a glance without lengthy analysis. For a long, wait for the ribbon in the lower part of the pane to change from red to green in an uptrend; for a short, use the opposite change. In a sideways market, wait until it reaches an extreme and starts to change colour.
Updated: · Midas Team
How the trend ribbon appears on the chart
The trend ribbon shows price waves, perfectly smooths out market fluctuations and false price movements to highlight only significant reversals.
It works very simply: the ribbon can be either green or red.
- The green ribbon is an upward wave.
- The red ribbon is a downward wave.
- The ribbon changes color at key points, giving a signal of a possible price reversal.
How to use the trend ribbon
The trend ribbon helps identify the beginning and end of the current wave and choose entry and profit-taking points.
- It helps you see the short-term trend and price direction instantly without much analysis, eliminating small market noises that can be misleading.
- For a long: in an uptrend, wait for the ribbon at the bottom to change from red to green before considering an entry.
- For a short: in a downtrend, wait for the ribbon at the top to change from green to red before considering an entry.
- In a sideways market, use both directions: wait until the ribbon reaches an extreme and begins to change colour.
During a bullish trend, the ribbon returns to green - this is the best time to enter a trade in the continuation of growth.
During a bearish trend, the ribbon returns to red – this is the best time to enter a trade in the continuation of the fall.
A simple trend-ribbon workflow
We use signals and branded trend ribbon, and when the ribbon goes green in the bullish trend, we wait for Buy and open the long. When the ribbon turns red in the bearish trend, we wait for Sell and open the shorts.
It works best in the trend direction and in sideways markets on higher timeframes. Experienced traders may enter earlier without waiting for a signal.
Advanced trend confirmation
The whole set of trending tools of the lower indicator works here, not one ribbon.
Global trend
Determine the direction of the money flow and wait for the trend ribbon to reverse in continuation of this trend.
Confirmation
Additionally, confirm the signal by turning the momentum of the price and the release of oscillators into the zone of overheating.
Signal entrance
After a Buy or Sell signal, consider a trade in the trend direction. This combination works best with the trend and in sideways markets on higher timeframes; experienced traders may enter earlier without waiting for a signal.
Did this guide help?
Thank you. Your answer was recorded.
Thank you for your feedback. You can continue in the English-language Midas bot. Open the English bot
Test Midas on your own TradingView chart
- Seven days free: Midas Up and Midas Down on your TradingView chart
- No card or prepayment: access is linked to one public TradingView username
- Markets available on TradingView and timeframes from one minute to one month; choose settings for the asset and trading style
No card. No payment. A TradingView username is public; never send a password.
8,400+ Midas indicator installations · 300+ client reviews · active since 2024

