
The same indicator for the scalper and for the investor works differently: on someone else’s strategy, the signals seem to be endless noise, then rare and late.
On someone else's strategy.
The scalper lacks signals, the investor drowns in noise, and the lower indicator stays silent when the Up and Down presets do not match.
On your strategy
Signal frequency matches your timeframe, the entry logic is clear, and Up and Down work in sync.
A strategy preset changes signal frequency and speed to match your style: Scalping provides many fast signals; Intraday is the default for trading within the day; Swing gives fewer, cleaner signals; and Investments provides rare, long-term signals.
Choose the timeframe you're really looking for: 1-5 minutes scalping, 15 minutes intraday, 4 hours swing, 1 day investing. The main rule that makes Down silent most of the time is changing the strategy on the top Up - put the same one on the bottom Down, otherwise some of the signals will disappear.
Updated: · Midas Team
Why change a strategy preset
This is one of the most powerful features of Midas, because it closes two pains at once: either there are too many signals and you drown in them, or there are too few of them and it seems that the market does not give anything.
Preset adjusts the frequency and speed of signals to your style, asset and timeframe. You don't need to collect everything from scratch - just choose a ready-made strategy from the list in the settings:
- Scalping (two lightning icons) is the fastest option for capturing each move: signals are frequent and appear quickly, with more noise.
- Scalping (one lightning icon) also provides many fast signals, but with less noise.
- Intraday (default) is a universal strategy for active trading inside the day: there are enough signals, appear with a slight delay.
- Swing is for medium-term trading: signals are less frequent, appear later and contain much less noise.
- Investments are for long-term trading: signals are rare, trades last longer and there is almost no noise.
How to choose your preset
Style is not chosen by the desired return, but by two simple things: how much time you actually spend on the chart and on what timeframe you look for entry. Signals that you do not have time to work out only interfere.
- You're at the screen all day, you're looking for 1-5 minutes, Scalping, there's a lot of signals, there's a lot of noise, but you're picking up the movement right away.
- You can log in several times a day, 15 minutes into the chart, Intraday, the one-size-fits-all, and it's a good place to start.
- If you check the chart a few times a day and enter on the four-hour timeframe, choose Swing; trades may last several days.
- If you build a long-term position and enter on the daily timeframe, choose Investments.
Settings and logic for each trading style
Each tab explains the trading style, the settings to use on both indicators and the steps for building a trade. The workflow is the same throughout (trend, zone, confirmation); only the timeframes and pace differ.
The first four tabs describe five style presets: two scalping variants, intraday, swing and investing. The last two are the special Bounce from a Level and Level Breakout modes in the same Strategy and Number of Signals list. A style preset changes signal frequency, while a special mode is selected for the type of setup at a level.
You do not need to calculate targets and stops manually: after a signal, the indicator marks the trade with three targets, their prices and percentage moves, a stop and a risk-to-reward ratio.
Scalping is short trades on the lower timeframes, where the market is constantly noisy, the task is not to catch a big trend, but to repeatedly pick up small movements, so you only need to enter where the price has a reason to react.
Settings: Strategy and Number of Signals - Scalping with one lightning bolt (signals appear just as quickly as in the two-bolt variant, but with less noise). Countertrend Signal Filter - Price Channel: countertrend signals are hidden automatically. Use the same settings on Midas Down.
Until you can repeat the workflow 20 times in a row, work on one lower timeframe, for example 5 minutes.
Trend.
On the price channel, watch the colour and slope: green and rising - look for Buy setups; red and falling - look for Sell setups; yellow and sideways - skip the asset to avoid unnecessary stop-outs.
Zone of interest
The channel boundaries show where to open a position: in a bullish trend, from the lower boundary; in a bearish trend, from the upper boundary. Skip trades from the middle of the range.
Confirmation and exit
Wait for the candle to close and the bounce to be confirmed: several candles fail to break through the boundary, then a Buy or Sell signal appears. Place the stop beyond the zone or the channel boundary. Take partial profit at the first target and move the stop to break-even. The main target is the nearest channel boundary, level or liquidity area.
- Once you are comfortable with the workflow, use three timeframes: 1 hour for context and trend, 15 minutes for the area of interest and 5 minutes for entry. Read signals only on the lower timeframe.
- Set alerts to trigger at candle close to avoid repeated notifications: Buy and Sell on the 5-minute timeframe, and bounces from levels on the 15-minute timeframe.
- Risk 0.5-1% per trade and always use a stop. For the first 20 trades, it is better to use the minimum position size.
- Don’t put a stop inside the liquidity zone: it is often collected along with your stop.
Intraday is movement in the day, the position lives from tens of minutes to several hours, you don't need to catch each candle, just exclude late entrances and entrances in the middle of the movement that has already occurred.
Settings: "Strategy and Signal Number" - "Intraday." Signals don't appear as fast as on scalping, but they're enough for trading intraday. "Filter signals against trend" - "Price channel" or EMA-200. The same values are set on Midas Down.
Beginners need one 15-minute timeframe.
Trend for today
Use the colour and slope of the price channel: when it rises, look for buys from the lower boundary; when it falls, look for sells from the upper boundary; when it is yellow and sideways, skip the asset.
Zone of interest
Wait for price to reach a channel boundary or strong level and react there. An entry without a zone is not a setup, even if a signal appears.
Confirmation and exit
Enter after the candle closes and the bounce is confirmed, with the stop beyond the zone. Take partial profit at the first target and move the stop to break-even, then manage the remaining position toward the nearest level or liquidity area.
- The advanced version uses three timeframes: 4 hours for trend and context, 1 hour for the area of interest and 15 minutes for entry (5 minutes if you prefer precise entries, 30 minutes if you are busy during the day).
- Alerts: at 15 minutes - Buy and Sell at the closing of the candle, at 1 hour - rebound from the level.
- Risk 0.5-1% per trade and always use a stop. Do not trade against the trend: these trades tend to make only short moves and frequently hit their stops.
Swing trading is about capturing a clear part of a trend rather than every candle. A trade may last several days, so filter out noise, wait for a strong higher-timeframe zone and enter only after confirmation, not in the middle of an impulse.
Settings: "Strategy and Signal Number" - "Swing." Signals don't appear as fast, but there's a lot less noise. "Filter of signals against trend" - "Price channel" or EMA-200. The same values are set on Midas Down.
Beginners need one 4-hour timeframe.
Trend.
Check the four-hour direction: trade buys when the channel is green and rising, trade sells when it is red and falling, and skip a sideways market.
Strong zone
Wait for price at a channel boundary or a horizontal level where it has reacted before. The stronger the zone, the calmer the trade: in swing trading, it is better to skip an entry than take a weak one.
Confirmation and trade management
Enter after the candle closes and the bounce is confirmed, with the stop beyond the zone. Take partial profit at the first target and manage the rest of the position toward the next strong level.
- The advanced option is three timeframes: 1 day for trend, 4 hours for interest zone, 1 hour for entry.
- Alerts: at 1 hour - Buy and Sell at the closing of the candle, at 4 hours - rebound from the level.
- Do not turn swing trading into intraday trading: if the trade follows a daily-timeframe setup, short-lived spikes on the 15-minute chart are not a signal for that trade.
The investment style is not to respond to every local impulse, but to look at the global trend and gain a position in strong zones closer to the bottom of the market, the main task is to gain a position at a good price in time.
Settings: "Strategy and Signal Number" - "Investment." Signals are rare, trades are long, there is almost no noise. "Filter signals against the trend" - "Price channel" or EMA-200. The same values are set on Midas Down.
Beginners need one day timeframe.
Global trend
On the daily chart, look for a clear uptrend: a green price channel sloping upward. Do not build a position against the global trend.
Position-building area
The lower channel boundary and strong levels are places to build a position in parts, rather than with a single purchase. This is the key difference of this style.
Confirmation and adding to the position
Wait until several candles fail to break through the zone, then add the remaining portion of the position on a Buy signal. The indicator marks the indicative targets and stop on the chart automatically.
- The advanced option is three timeframes: 1 week for a global trend, 1 day for a zone of interest, 4 hours for entry.
- Alerts: at 4 hours - Buy and Sell at the closing of the candle, at 1 day - rebound from the level.
- Rare signals are normal for style: on a daily chart, there may be one or two per month.
A bounce occurs when price reaches a level, pierces it with a wick and returns without the candle body closing beyond the level. The level has held, so a trade away from it may be considered.
For bounce signals, select the special Bounce from a Level mode in the Strategy and Number of Signals list. Keep the trend filter enabled to avoid looking for bounces against the main move.
Level.
Use only the zones drawn by Midas itself: strong horizontal levels and price-channel boundaries. The more touches a zone has already withstood, the more reliable it is.
Reaction
Wait for a touch: wicks may pierce the level, but the candle body must not close beyond it. Until the candle closes, the bounce is not confirmed.
Entry, stop, target
Enter after the candle closes and the lower indicator gives a confirming signal. Place the stop beyond the level and target the nearest opposite zone or channel boundary.
- If the candle body closes beyond the level, it is a breakout rather than a bounce: the setup changes and the bounce entry is cancelled.
- Rebound against the trend is the weakest option: the level may not withstand the second approach.
- False breakouts occur frequently in sideways markets, so it is especially important to wait for the candle to close.
A breakout occurs when a candle pierces a level and its body closes beyond it. The level no longer holds price, so Midas removes it from the chart: the market has entered a new range and the old zone is no longer treated as a reversal point.
Trade a breakout in the direction of the move, not against it. The calmer entry is to wait for price to return and test the level from the other side, rather than chase the breakout candle.
Candle body closes beyond the level
Wait for the candle body to close beyond the zone. A wick piercing the level is still a possible bounce, so it is too early to trade a breakout.
Level's gone.
Midas removes the broken zone from the chart, confirming that it has played out. The indicator redraws the nearest targets to reflect the new market picture.
Entry on the retest
Wait for price to return to the broken level, where former resistance may act as support and vice versa. Place the stop beyond the level and use the next zone in the direction of the move as the target.
- A breakout in the direction of the trend is more reliable than a countertrend breakout; a move against the trend often turns out to be a false breakout.
- A breakout on low volume is often false: check volume and money flow on the lower indicator.
- A retest may not occur. If price continues without returning, skip the entry rather than chase the market.
Rules shared by every preset
Style changes pace and timeframes, but it doesn't change basic entry rules. These five points are the same for scalping and for investing -- they're the ones that most often break the result, not the preset you choose.
- Do not trade a signal without a level: an entry in the middle of nowhere lacks a setup.
- Do not trade against the trend; countertrend setups are covered separately.
- Wait for the candle to close: entering on a signal that is still forming turns trading into guesswork.
- We are waiting for confirmation: several candles failed to break the level.
- The risk of a transaction is 0.5-1%, stop is mandatory, the first 20 transactions are at the minimum volume.
Mini-checklist before entry
Answer all five questions before entering. If even one answer is no, skip the trade; the market will always provide another opportunity.
- Does the price channel show direction?
- Has price reached a channel boundary or a strong level?
- Is the signal aligned with the higher-timeframe trend?
- Is the candle closed?
- Is the stop behind the zone, not inside the liquidity?
Correct and incorrect chart examples
The rules are common in all styles: trade from the zone and in the direction of the trend. Below are four frames - two correct trades and two typical errors, because of which the signals "do not work".
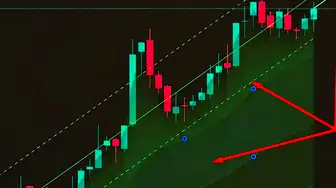
We see a clear upward trend: the green price channel is rising.
Wait for price to reach the lower channel boundary, confirm the bounce and receive a signal, then open a long trade and take profit near the upper channel boundary.
We see a clear downward trend: the red price channel is falling.
Wait for price to reach the upper channel boundary, confirm the bounce and receive a signal, then open a short trade and take profit near the lower channel boundary.
The trend is down, the channel is down, the only difference is where the signal came from.
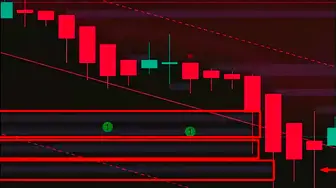
- Bad: Sell appeared in the middle of the range, far from the upper end of the channel. There's no price support here.
- Good: Sell appeared at the upper edge of the channel, in the direction of trend.
Anti-trend signals almost always give a short run, increased risk and frequent stops.
- Bad: Buy in the red channel when the trend is down.
- Good: Buy in the green channel when the trend is up.
Time of day and market sessions
Intraday is heavily dependent on liquidity and volatility, and they change throughout the day.
- Do not open a new position 5-10 minutes before a key release or news event.
- Wait 2-5 minutes after the news release (or until the candle calms down) and only then analyze.
- If you still trade releases: less trade volume, wider admission to slippage and no stops in the liquidity zone.
Round-the-clock markets (24/7)
The best windows for liquidity: 10:00-13:00 (Europe wakes up), 16:00-20:00 (Europe and the United States simultaneously, most often the strongest movement), 20:00-01:00 (US drags the market further).
The most powerful are the US macro releases:
- CPI and NFP are released at 8:30 New York time, which is approximately 16:30 Moscow time in winter and 15:30 in summer.
- ISM PMI - at 10:00 New York, approximately 18:00 Moscow time in winter and 17:00 in summer.
- The Fed decision is released at 14:00 New York time, followed by a press conference at 14:30: approximately 22:00 and 22:30 Moscow time in winter, and 21:00 and 21:30 in summer.
- There are no market-closure gaps here, but overnight liquidity is thin and sharp wick spikes can occur, especially from 03:00 to 07:00 Moscow time.
- As a practical rule, do not open new positions 5-10 minutes before a release or move stops during the first 1-3 minutes after it: noise and slippage are common.
Russian shares (Moscow Exchange)
The trading windows are divided into morning, main and evening parts:
- Morning: 06:50-09:50, including the opening auction from 06:50.
- Main session: 10:00-19:00.
- Evening: 19:05-23:50.
- Corporate news (dividends, reports, boards of directors, sanctions messages) often arrive outside the liquid middle of the day, so morning and evening movements are more ragged.
- If you carry a position overnight, do so deliberately: reduce its size, place the stop where evening whipsaws will not trigger it and be prepared for a morning gap.
American stocks (NYSE and Nasdaq)
The main session of the exchange runs from 9:30 to 16:00 New York City, plus extended hours, in Moscow time, it floats due to the transition of the United States to daylight saving time.
- Main session: 17:30-00:00 Moscow time in winter and 16:30-23:00 in summer.
- After-hours session (until 20:00 New York time): until 04:00 Moscow time in winter and 03:00 in summer.
- Releases at 8:30 New York City (CPI, NFP) are out before the stock market opens - hence the gaps and jerks at the opening.
- The ISM at 10:00 New York time is already in the active trading phase, and the Fed’s decision at 14:00 and 14:30 usually gives the most volatile part of the day.
- Companies report more often after closing or before opening, so holding a position overnight is a lottery. Intraday positions are usually closed until the end of the session.
Forex (24/5)
Sessions on Moscow time:
- Sydney: 00:00-09:00.
- Tokyo: 03:00-12:00.
- London: 10:00-19:00 (can shift by an hour during the transition to daylight saving time).
- New York: 16:00-01:00.
- The most liquid window is the overlap of London and New York, approximately 16:00-20:00 Moscow time.
- The key releases are the same: 8:30 New York time (CPI, NFP), 10:00 (ISM), 14:00 and 14:30 (Fed).
- Monday through Friday, the market is open around the clock, but the weekend creates gap risk. On weekday nights, liquidity is thinner, spreads are wider and random stop-outs are more common.
How to switch presets
Open the indicator settings
The gear next to the name Midas Up on the chart.
indicator settings window: the Arguments tab and the main parameters Select a strategy from the list
Choose Scalping, Intraday, Swing or Investments to match your pace. The trend signal filter is available in the same settings section.
Two points are highlighted in the settings: strategy and anti-trend signal filter Repeat the same on Midas Down
The upper and lower indicators should be on the same preset, otherwise the signals will be out of sync.
If Midas Down becomes quiet after a preset change
This is the most common case: the preset is changed only to Up. Open Down settings and set the same strategy - the signals will return.
Preset questions
What's more important, the level or the signal?
The zone is more important. A signal without a zone often becomes an entry in the middle of a move, where price has no clear reason to react.
What if the channel is yellow and the market is sideways?
A yellow channel means the market is moving sideways. Beginners should skip the asset because this phase produces the most noisy signals; experienced traders should work only from boundaries and strong levels, not from the middle of the range.
How to remove signals against the trend?
Turn on the "Filter of signals against the trend" - "Price channel" or EMA-200, counter signals will stop appearing on the chart. The filter is placed on both indicators, as well as the strategy itself. More details - in step 5.
Why didn't the level work?
Any level can be broken. Work with strong levels where price has already reacted at least twice, and wait for confirmation: several consecutive candles fail to break through the zone.
Which timeframe should I use for signals if the strategy also uses higher timeframes?
Look for signals only on your entry timeframe. Higher timeframes provide the trend and zone context; ignore their entry signals.
The signal is essentially a current wave, and the waves are different at different periods, so Buy on one timeframe and Sell on the other is a normal picture, not a breakdown.
How to test your chosen strategy without risking money?
Uncheck the "Show only the last signal" box, and all the past signals will appear on the chart, and they don't repaint after the candle is closed, so you can see from history where the strategy worked and where it didn't.
The full statistics on your settings are given by Autotester mode, which is Route 6, and if you have a paid TradingView subscription, the market simulator helps: roll back the chart and open virtual trades until the result is stable.
Did this guide help?
Thank you. Your answer was recorded.
Thank you for your feedback. You can continue in the English-language Midas bot. Open the English bot
Test Midas on your own TradingView chart
- Seven days free: Midas Up and Midas Down on your TradingView chart
- No card or prepayment: access is linked to one public TradingView username
- Markets available on TradingView and timeframes from one minute to one month; choose settings for the asset and trading style
No card. No payment. A TradingView username is public; never send a password.
8,400+ Midas indicator installations · 300+ client reviews · active since 2024

