
You have found the zone, but entry timing still feels subjective: price is approaching, so should you enter or wait?
Entry by feel
You enter too early and hit the stop, or enter too late after most of the move has passed.
Entry confirmation
Flow, momentum, delta and overheating either confirm the entry or honestly cancel it.
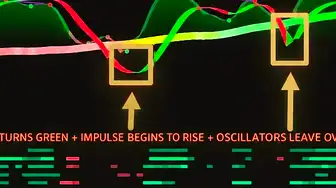
Midas Down is the lower indicator in the Midas trading system. It runs in a separate pane below the chart, shows price-wave reversals and confirms entry timing. Midas Up answers where and from which zone to trade; Midas Down helps answer whether it is time to enter. Its selectable layers include money flow for the broader movement and potential market bottoms or peaks, the trend ribbon for the start and end of a wave, and price momentum for movement strength and reversal points.
A separate group of tools monitors large participants through accumulation and distribution phases, impulse trades and Pump and Dump signals. Volume delta shows which side dominated within a candle, while the overheating scale combines six popular oscillators in one strip. The more layers converge at one point, the stronger the entry confirmation.
Updated: · Midas Team
Why the lower indicator is useful
The bottom indicator is used to confirm the entry point and see the current wave reversal more accurately, so you can use it to determine exactly when to open a position and confirm the setup.
A fundamental trading process is to determine the trend, find a strong level, confirm the price reaction and time the trade. Midas uses two indicators for these tasks: Midas Up shows trend direction and strong support and resistance zones, helping you choose a direction and an area to watch; Midas Down shows price-wave reversals and helps select the entry timing.
When you already understand the direction of the market and know which zone you want to work from, Midas Down helps you not to go on emotions, but to wait for the confirmation of the price reaction in the desired zone - this makes the analysis calmer and more disciplined.
- Watch the moment of the price wave reversal: money flow, trend ribbon and price momentum - choose the method that is more convenient for you personally.
- Analyse large-participant behaviour: accumulation and distribution phases, impulse trades and Pump and Dump signals help identify the market phase and follow large capital.
- Confirm the entry point: the overheating scale, delta volumes and momentum reversal points give additional confirmation before the transaction.
How Midas Down is built into the trading system
Once you know the trade direction and entry area, wait for price to reach that area and provide confirmation. Do not enter in the middle of nowhere; waiting for a pre-marked zone reduces emotional entries.
When the price comes to your area of interest, wait for the signal Buy or Sell (how to read it - on the page about signals, strategies and presets) and look at Midas Down. Its task is not to look for the zone, but to help understand whether there is an entry confirmation right now.
Learn the layers gradually rather than reading everything at once. Start with the trend ribbon, which highlights price-wave reversals and smooths manipulative noise. With experience, add large-participant activity, oscillator overheating, volume delta and other advanced tools.
Lower indicator tools
Six pages cover the six layers. Start with the trend ribbon, then add the remaining tools as you gain experience.
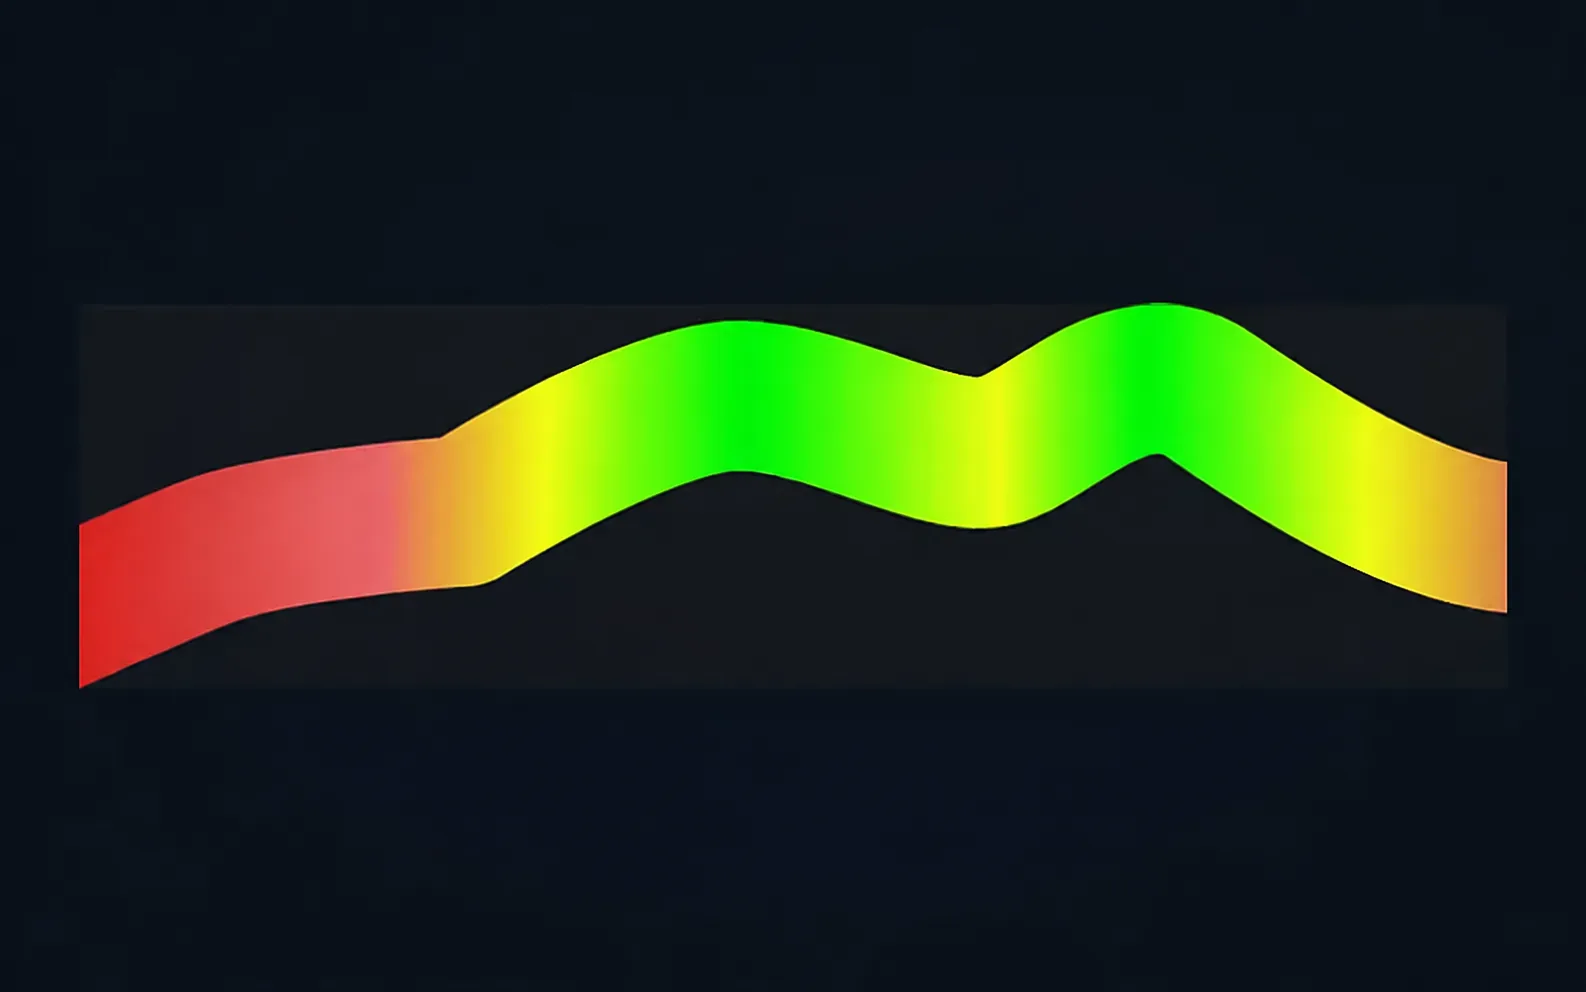 Money flowGlobal movement of money in the asset: the bottom and peak of the market, the change in trendHow to read the stream
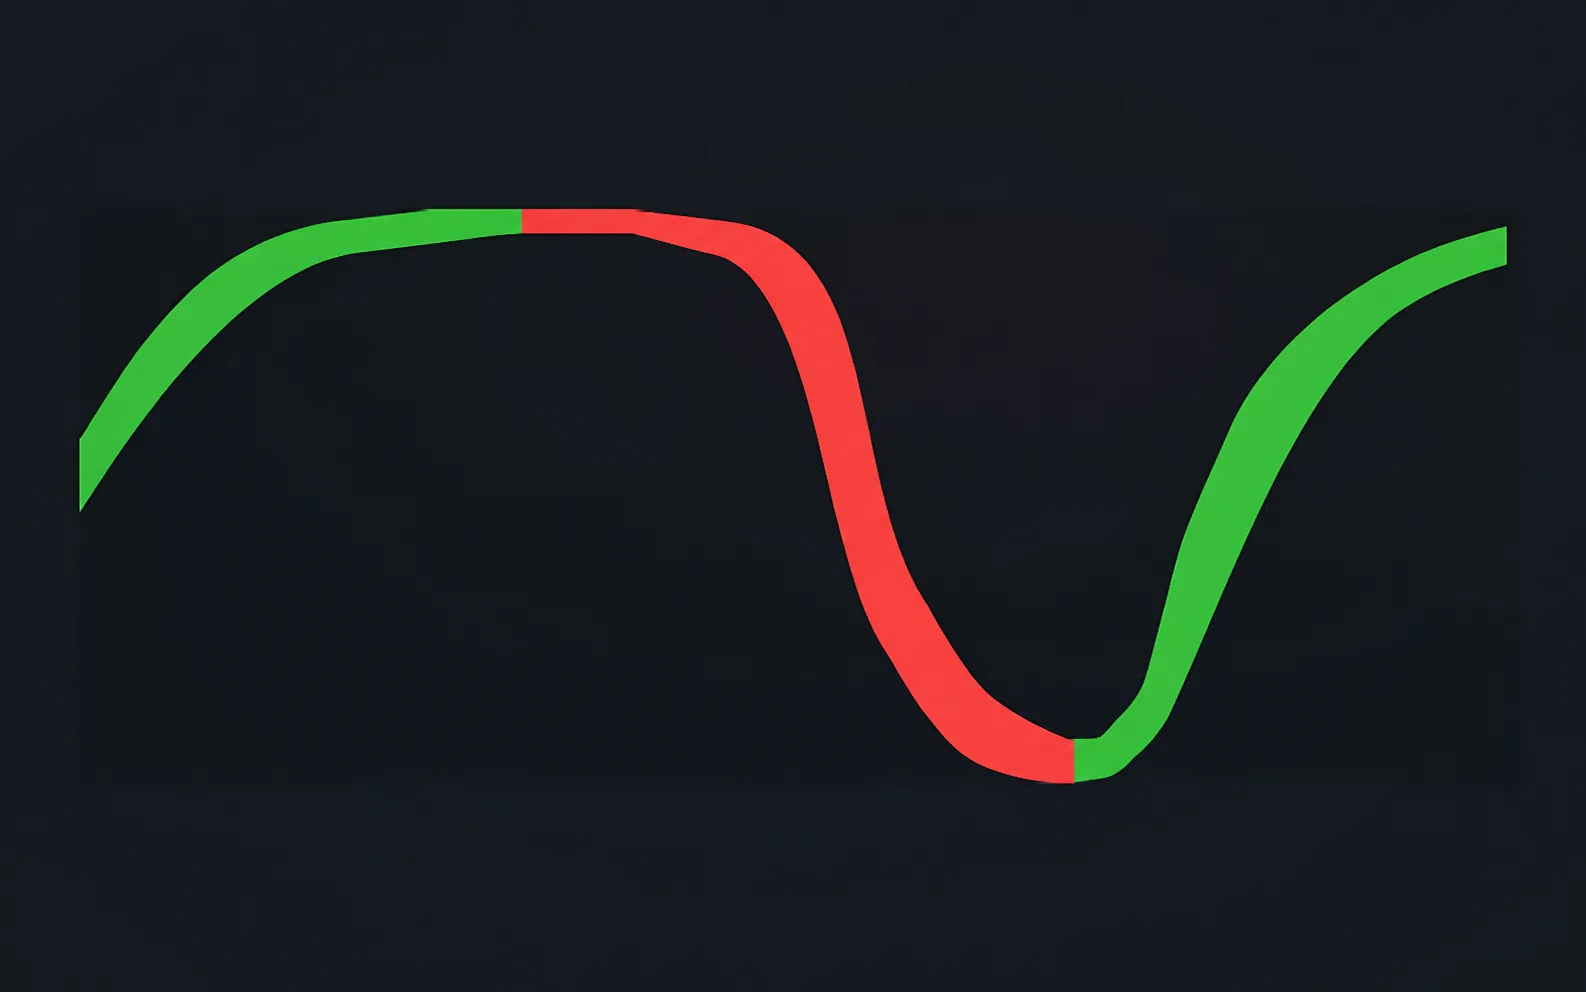 Trend ribbonThe beginning and end of a wave: ribbon colour changes mark the reversalHow to trade using the ribbon
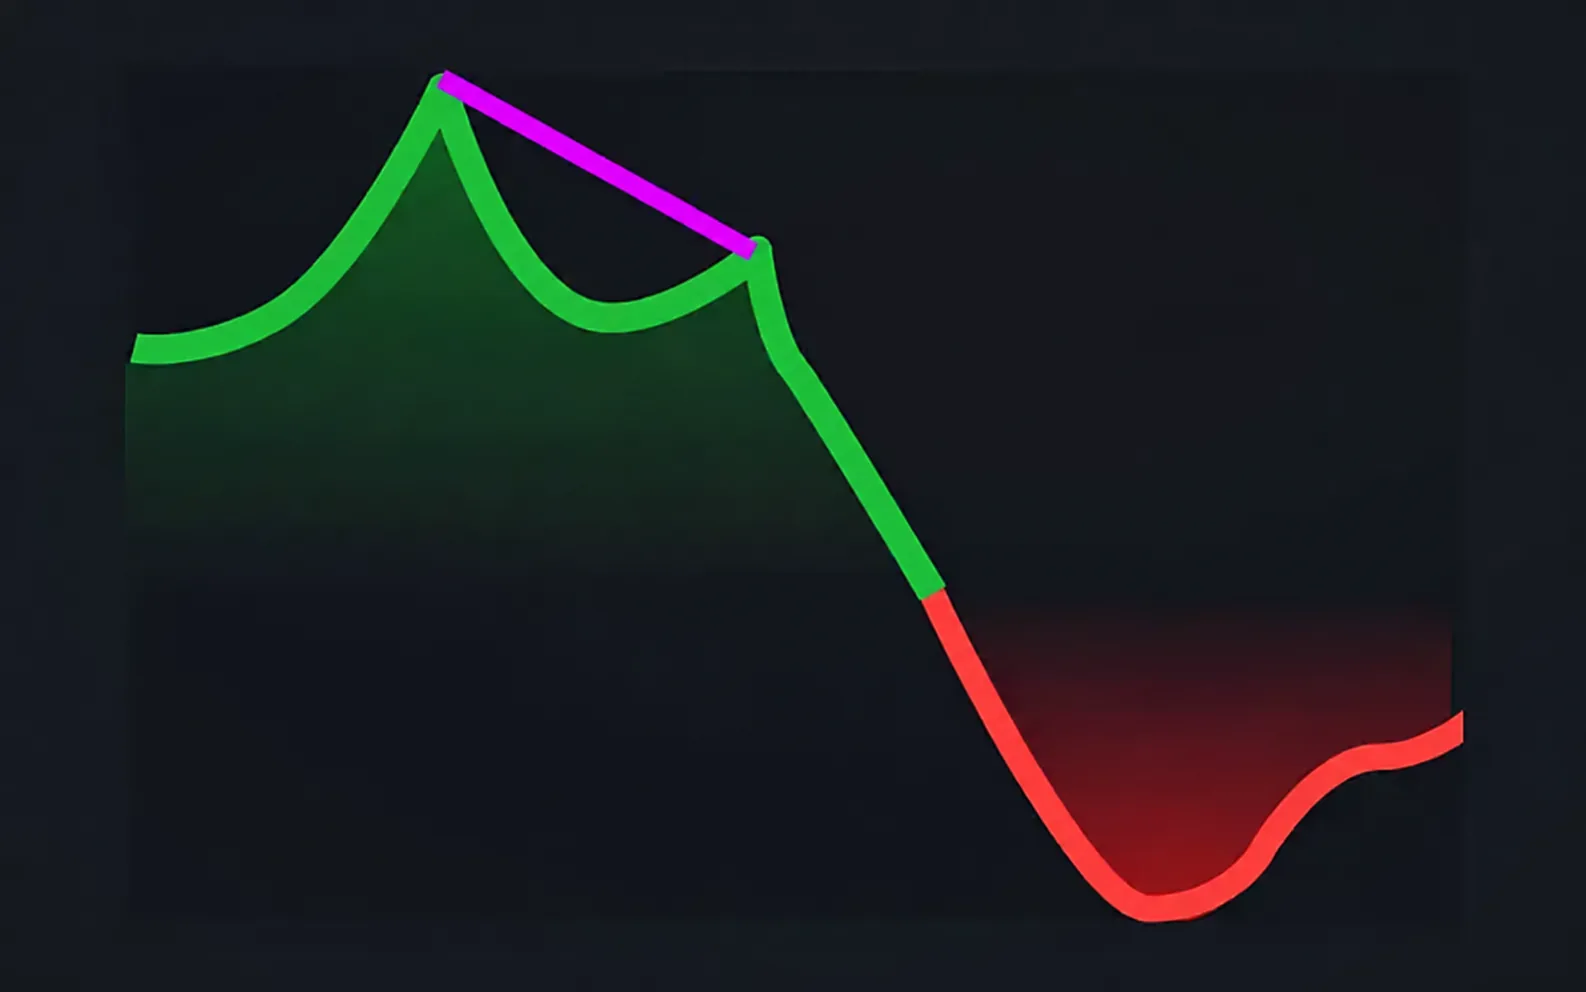 Price momentumStrength and quality of the wave, reversal points and position finishing zonesHow to read a pulse
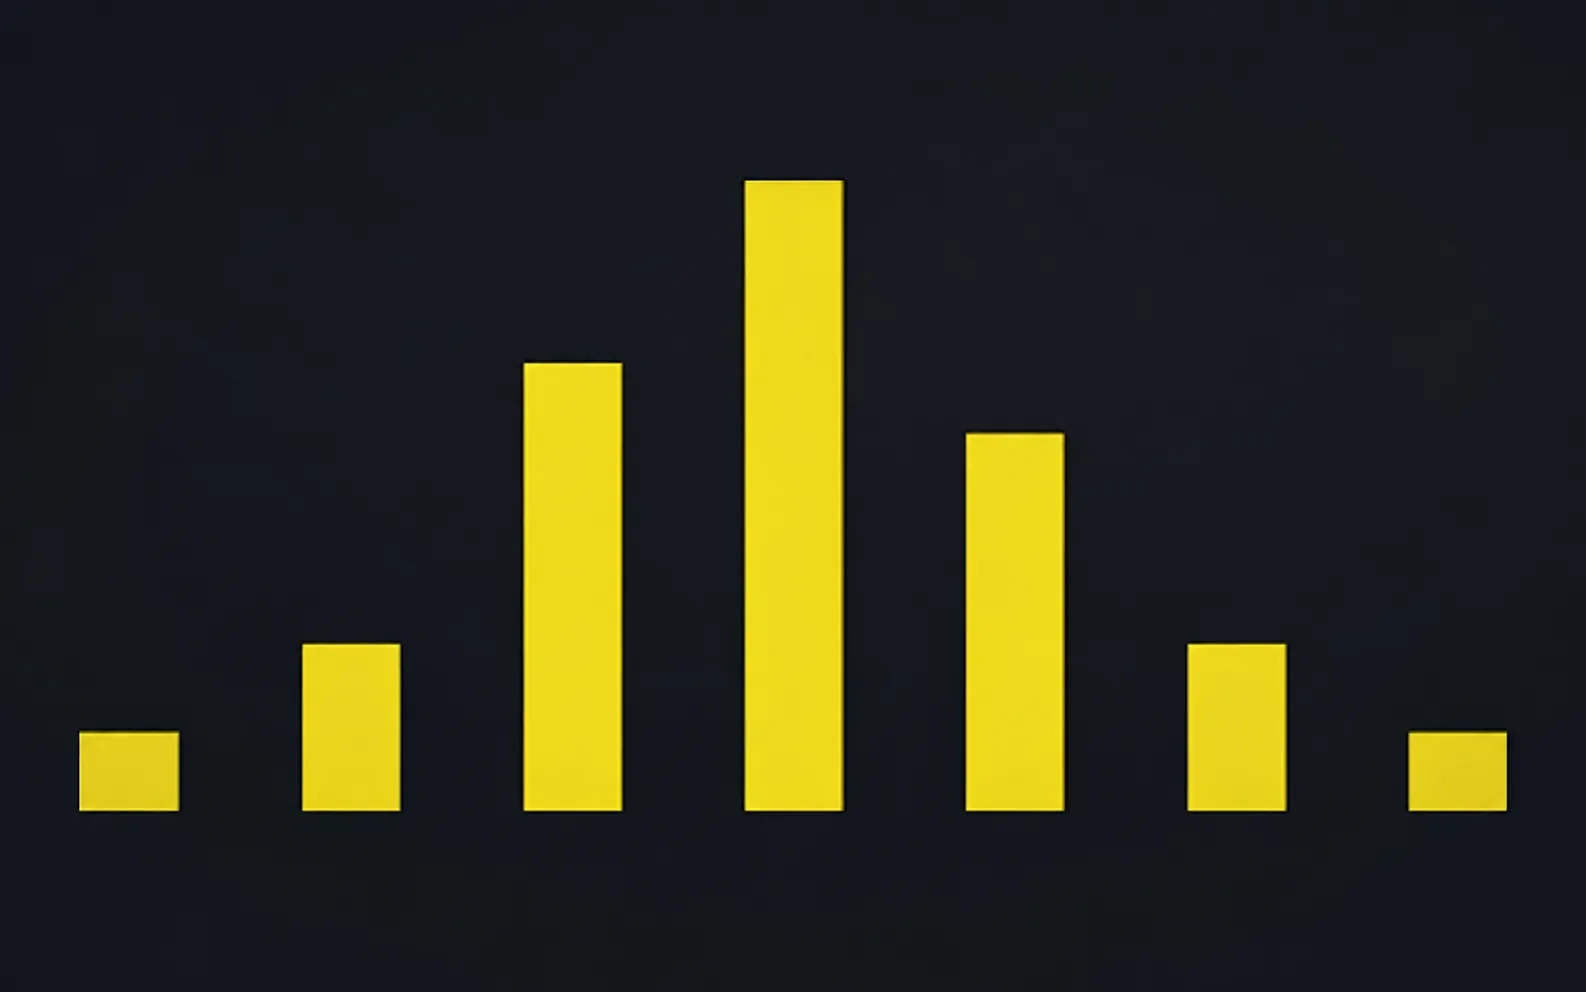 Whale movementAccumulation and distribution phases, large impulse trades, pumps and dumpsHow to go after whales
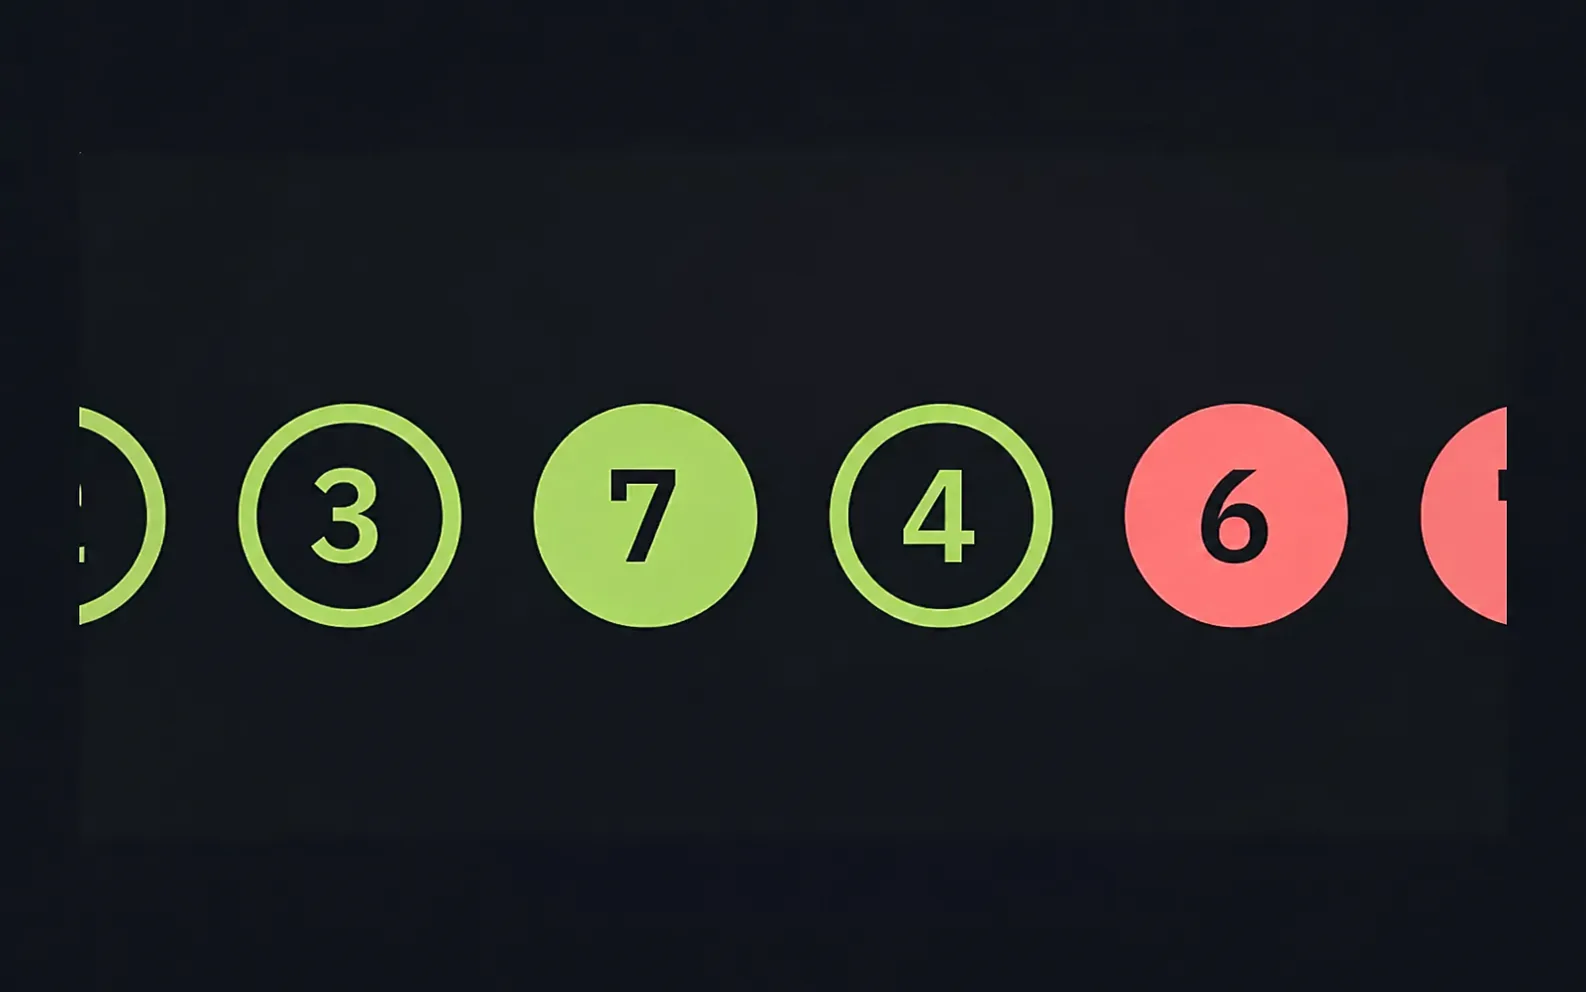 Delta volumesWho won inside the candle and how strong the edge wasHow to read the delta
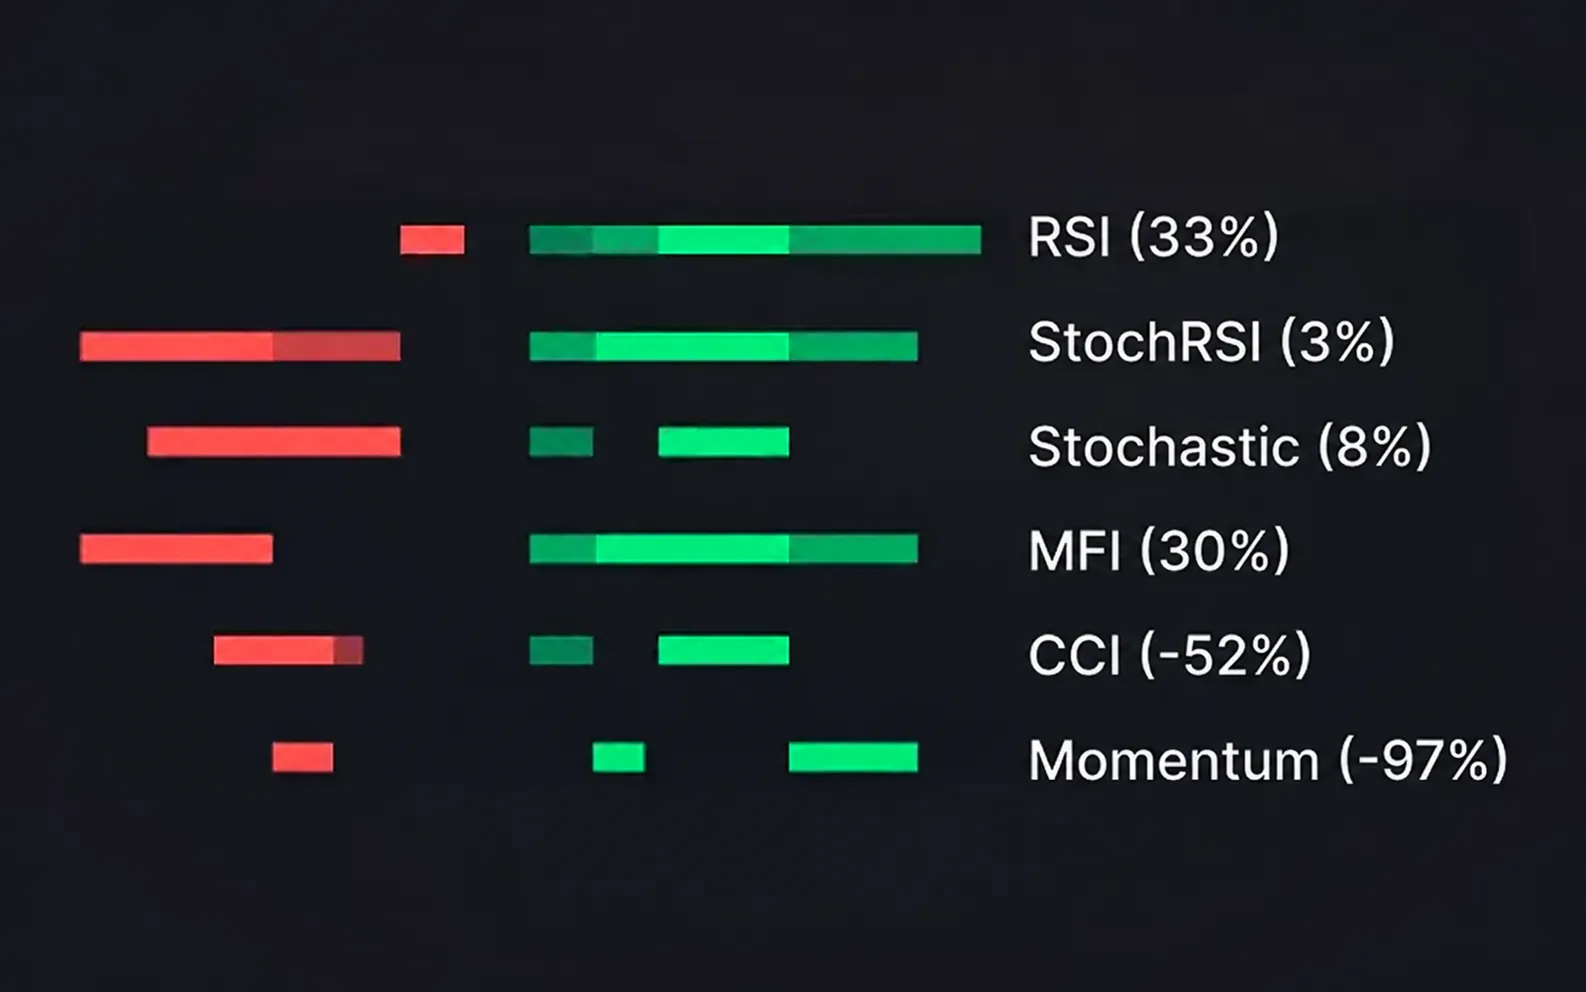 The overheating scaleSix oscillators in one strip: overbought and oversoldHow to read overheating
Build confirmation from several layers
The strongest setups are when several layers of the bottom indicator show the same thing.
Determine the global trend in money flow
Work in the flow direction; trades against large capital tend to be less durable.
Wait for the trend ribbon to reverse in the direction of the trend
This marks the beginning of a new wave, not the middle of the old one.
Confirm the signal with impulse and overheating
A momentum reversal together with oscillators leaving an extreme zone adds confirmation.
Wait for the Buy signal or Sell signal in your zone
The arrow appeared in your zone - check the context of your strategy and decide whether to enter; how to read the signal and its goals, discussed on the page about signals, strategies and presets.
Did this guide help?
Thank you. Your answer was recorded.
Thank you for your feedback. You can continue in the English-language Midas bot. Open the English bot
Test Midas on your own TradingView chart
- Seven days free: Midas Up and Midas Down on your TradingView chart
- No card or prepayment: access is linked to one public TradingView username
- Markets available on TradingView and timeframes from one minute to one month; choose settings for the asset and trading style
No card. No payment. A TradingView username is public; never send a password.
8,400+ Midas indicator installations · 300+ client reviews · active since 2024

