
Price moves within a range, but you enter in the middle, where little room remains before the next boundary.
Entry in the middle of nowhere
Only half the move remains to the nearest boundary, there is no clear place for a stop, and the risk is undefined.
Entry from the boundary
The channel shows its boundaries and slope: trade from a boundary in the trend direction and place the stop beyond it.
The indicator automatically builds the current price channel and colours it by local trend: green for an uptrend, red for a downtrend and yellow for a sideways market in equilibrium. A steeper slope indicates a stronger trend.
Channel boundaries act as dynamic trend levels: the lower boundary is support where long trades may be considered, while the upper boundary is resistance where short trades may be considered. The centre line works in the same way and often changes role after a breakout. Channel width reflects volatility: a wide channel indicates a strong move, while a narrow channel indicates consolidation before a possible impulse.
Updated: · Midas Team
How the price channel appears on the chart
The indicator automatically draws the current price channel, within the boundaries of which the price moves:
- The green channel is an upward trend.
- The Red Channel is a downward local trend.
- Yellow channel - sideways movement, the market equilibrium.
- The higher the angle of inclination, the stronger the trend.
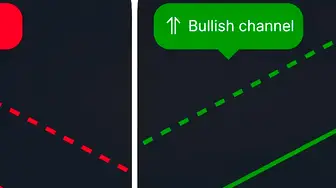
The channel is painted green: the local trend is up.
The channel is painted red: the local trend is down.
The channel is painted yellow: the price is in equilibrium, there is no pronounced trend.
How to use the channel in analysis
Channel boundaries are often used as trend levels from which the price can bounce, the price is held for a long time inside the channel:
- The lower border acts as a support, where the price can find support, at which point it is worth considering the purchase transactions.
- The upper limit often works as a resistance where the price can slow down or reverse – it’s worth considering selling trades here.
- The central line works in a similar way and is also support and resistance.
- Use the channel direction to filter false signals against the trend.
The example shows how the price slows down, approaching the lower boundary of the channel, then follows a reversal; similarly, the price reacts from the upper boundary.
A safe option is to trade from the upper bounds in a downward channel in continuation of a bearish trend.
The example shows how the price slows down, approaching the lower boundary of the channel, then follows a reversal and further continuation of growth according to the trend.
A safe option is to trade from the lower bounds in the upward channel in continuation of the bullish trend.
Price slows near the channel's centre line, rebounds and continues the move. After price breaks through the centre line, the line may change role and become resistance.
Channel width and volatility
Channel width is used to assess volatility:
- Broad channel – high volatility and strong trend.
- A narrow channel is a weak trend or price consolidation.
A wide channel indicates high asset volatility and a strong trend; in this example, the width is 52% of the net move.
A narrow channel indicates low volatility and consolidation; in this example, the width is only 2% of the net move.
A simple price-channel workflow
Use the price channel together with signals: when price reaches the lower boundary of a green channel, wait for a Buy signal before considering a long trade; when price reaches the upper boundary of a red channel, wait for a Sell signal before considering a short trade.
- It works best in the trend direction and in sideways markets on higher timeframes.
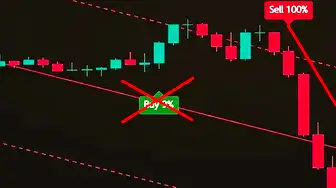
- Against the trend, it is better to skip the signals - see the example in the screenshot.
- Experienced traders can open trades earlier without waiting for the signal.
Did this guide help?
Thank you. Your answer was recorded.
Thank you for your feedback. You can continue in the English-language Midas bot. Open the English bot
Test Midas on your own TradingView chart
- Seven days free: Midas Up and Midas Down on your TradingView chart
- No card or prepayment: access is linked to one public TradingView username
- Markets available on TradingView and timeframes from one minute to one month; choose settings for the asset and trading style
No card. No payment. A TradingView username is public; never send a password.
8,400+ Midas indicator installations · 300+ client reviews · active since 2024

