
Without marking, the chart is just candles: it is not clear where the market is going and where to wait for the price.
Hand-marking
Each level has its own, half the time is spent on drawing lines, not on a deal.
Markup from Midas Up
Trend, channel boundaries, strong levels and areas of interest appear on their own – it remains to choose a point.
Midas Up is the top Midas indicator: it is drawn directly on the price chart and is used to understand the direction of the market and find areas of interest from which the price can react.
Direction comes from the EMA set for the global trend and the price channel for the local trend: green means rising, red means falling and yellow means a sideways market. Three tools identify areas of interest: strength-rated horizontal levels, the horizontal volume profile and the liquidity heatmap, which highlights clusters of stop orders that may attract price. Candle hints add buyer and seller pressure, Pump and Dump labels and a divergence counter based on 11 oscillators. The sequence is always trend, then zone, then signal; signals against the trend contain more noise.

Updated: · Midas Team
Why the upper indicator is useful
The top indicator is used to understand the direction of the market and to find areas of interest from which the price can react, and with this you can accurately determine the trend and the levels of support and resistance from which you will make trades.
Instead of manually marking up and trying to understand the market by eye, you immediately get a fully structured picture:
- Where is it better to look, and what transactions to miss?
- where the trend is and when it changes;
- where are the strong levels from which the price will bounce;
- Identify areas in which to close a trade and wait for a reversal.
How Midas Up fits the trading process
A fundamental trading process is to determine the trend, find a strong level, confirm the price reaction and time the trade. Midas uses two indicators for these tasks: Midas Up shows trend direction and strong support and resistance zones, while Midas Down shows a price-wave reversal and helps time an entry.
The first two steps of the system are made by the top indicator.
Identify the trend
Open the chart and start with the upper indicator on a single timeframe instead of jumping between periods. Your first task is to choose the direction in which you want to trade, not to search for an immediate entry. The EMA set and price channel show market direction by colour. A yellow channel with crossing EMAs indicates a sideways market, where beginners should usually avoid trading because signals are noisy. Trading against the trend, trying to catch every correction or constantly predicting a reversal increases the risk of losses: there will be many opportunities to trade with a trend, but only one actual reversal. With experience, add money flow and large-participant accumulation or distribution to assess the broader market phase and a possible trend change; both tools are explained on the Midas Down page.
Finding areas of interest
Next, find an area where price is likely to react so that a trade can begin near the start of a move rather than after most of it has passed. Use the automatically marked channel boundaries and support and resistance levels. In a clear trend, look for reactions from the price-channel boundary only in the trend direction. In a sideways market, focus on reactions from horizontal levels. Signals naturally appear after part of the initial move, so the strongest potential comes from trading at well-defined levels with entry confirmation from the lower indicator. With experience, add the liquidity heatmap and horizontal volume profile to judge which levels are strongest and where price may be attracted.
Price repeatedly reacts at automatic levels: entries at the very start of the move
Top indicator tools
Six pages, one for each tool, inside: video lessons that the tool draws, tabbed examples, and a simple trading strategy.
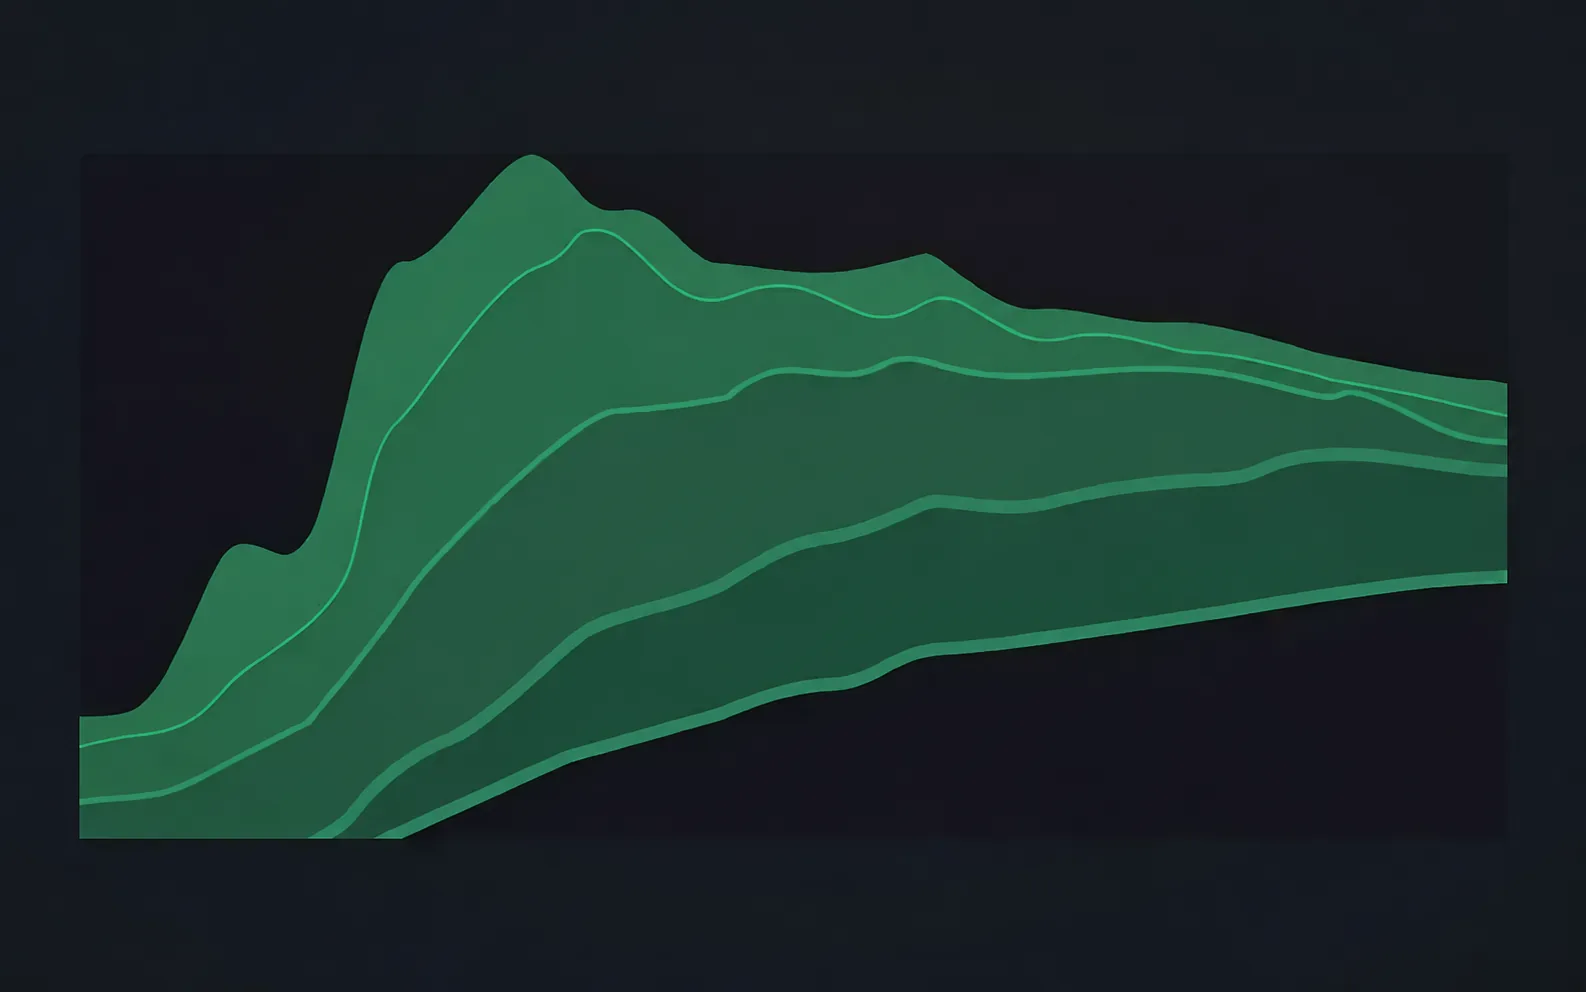 Sliding EMAsGlobal trend direction and trend levels: EMA 20, 50, 100 and 200How to read an EMA
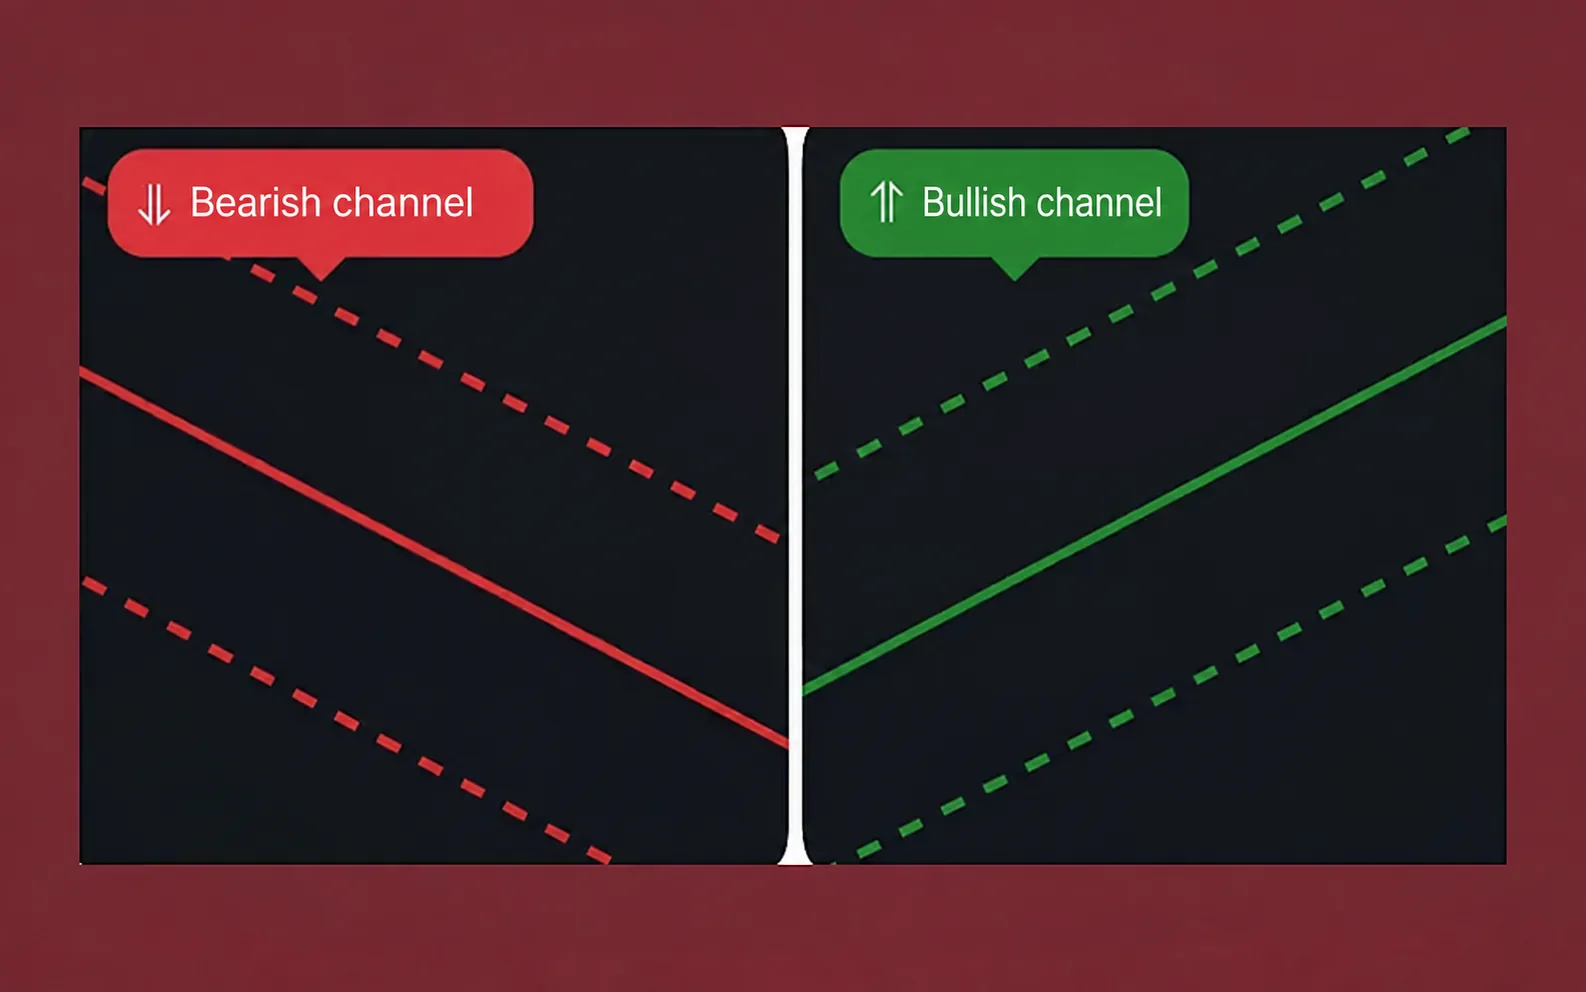 Price channelLocal trend, its boundaries and width: where to wait for the rebound, and where the momentumHow to trade in the channel
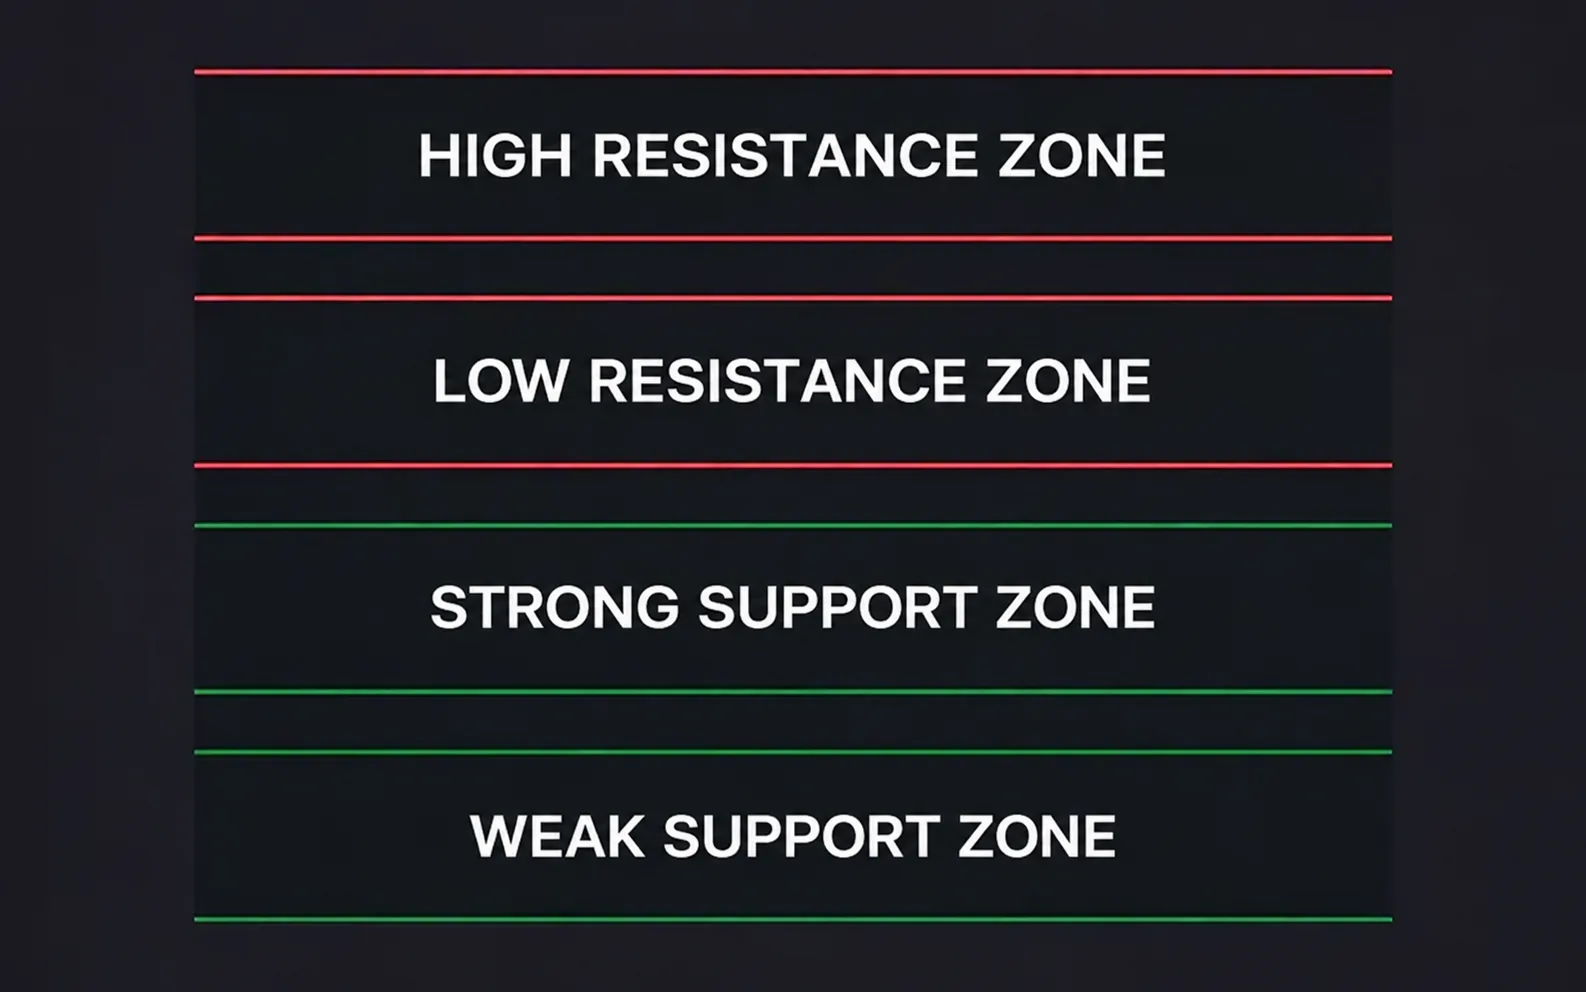 Horizontal levelsSupport and resistance with strength assessment: rebound, breakout and retestHow to trade from levels
 Volume profileTrade shelves and POC: where the big players gained positionsHow to trade from shelves
 Heat map of liquidityClusters of other people's stops: where the price pulls a magnet and where to put your ownHow to Read Liquidity
 Candle hintsMarket pressure, Pump and Dump, candle divergence counterHow to Read Tips
Combine the layers into one setup
A strong entry is a convergence of multiple factors at one point: using horizontal support and resistance levels, a price channel, moving EMAs, horizontal volumes and a heat map of liquidity together.
Find a level match
We look for strong horizontal levels on the chart, which coincide with the boundaries of the price channel and horizontal volume shelves.
Confirm the importance of the zone
We confirm the importance of the level by the presence of a nearby EMA or liquidity in the form of stops.
Wait for the signal.
When the price approaches an important support area, wait for the BUY signal and open the long; when the price approaches the important resistance zone, wait for the SELL signal and open the short.
rebound from support level that coincided with the channel boundary and volume shelf
What's important to remember
The three rules of this bundle:
- You don’t have to wait for all the factors to coincide – just two or three are enough.
- Just remember: the more coincidences, the higher the chance of working out the signal.
- It works best in the direction of the current trend and in a sideways market.
Did this guide help?
Thank you. Your answer was recorded.
Thank you for your feedback. You can continue in the English-language Midas bot. Open the English bot
Test Midas on your own TradingView chart
- Seven days free: Midas Up and Midas Down on your TradingView chart
- No card or prepayment: access is linked to one public TradingView username
- Markets available on TradingView and timeframes from one minute to one month; choose settings for the asset and trading style
No card. No payment. A TradingView username is public; never send a password.
8,400+ Midas indicator installations · 300+ client reviews · active since 2024

