
The price seems to specifically remove your stop and then goes in your direction.
Stop right where everyone else is.
A cluster of stop-losses is an attractive source of liquidity, so price may move toward it.
Stop with a look at the map
You can see where the stops have accumulated and where the market can go for liquidity.
The heatmap shows where liquidity is concentrated in stop orders. Purple bands below price represent stops from long traders, while bands above price represent stops from short traders. A brighter band indicates a larger stop cluster and a potentially stronger attraction for price.
Price often moves toward areas of high liquidity, where large participants can build or close positions more easily, and this can trigger clustered stop orders. After the liquidity is collected, price often reverses, so these areas can help with entries and profit-taking. Do not place your own stop inside a liquidity cluster.

Updated: · Midas Team
How the liquidity heatmap appears on the chart
The heatmap shows where stop-order liquidity has accumulated and how large each cluster is:
- Purple stripes under the price - stop orders of those in long positions.
- Purple stripes above the price are stop orders of those in short positions.
- Bright purple strips - maximum accumulation of stops, a strong magnet for the price.
The example shows where small market participants hid their stop-loss – for local lows: purple zones below the current price show clusters of stop-loss of those who opened the long.
This is where the price will go when it falls next, to activate these stop losses, and once it reaches these zones, it's likely that the price will turn upwards, and you can use that to open a long position.
The example shows where the stop-loss those who opened the shorts hid - for local highs: purple zones are higher than the current price.
This is where the price will go at a near rise to activate these stop losses, and once these zones are reached, a downward reversal is likely to occur, which can be used to open a short position.
A bright purple line is the maximum accumulation of liquidity that works as a strong magnet for price.
When such a line is reached, a reversal is possible with the greatest probability.
How to use liquidity zones
Price always tends toward areas of high liquidity, where large participants can more easily build or close positions. They move price toward these zones to trigger weaker traders' stops.
- Identify the nearest liquidity clusters to anticipate a possible price target and trade in that direction.
- After price collects the liquidity, it may reverse; use these zones to plan entries and take profit.
- When there is a lot of liquidity, a cascading effect is possible: the price will accelerate, taking the stops until it collects everything, and then it will turn around.
- Don’t put your stops in the liquidity zone, otherwise you will become liquidity.
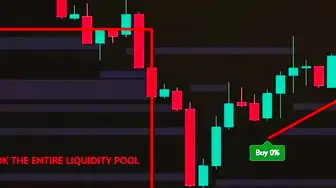
In this example, price cleared the accumulated liquidity and formed a new liquidity pool from long traders' stops. That pool can become a strong attraction for price.
The same chart a few hours later: after accelerating, price reversed and moved toward the liquidity below.
If you combine liquidity analysis with levels, you can determine with high probability where the price will bounce off the level and where it will go.
A simple liquidity-heatmap workflow
Use signals with the liquidity heat map: after price clears liquidity below, wait for a Buy signal before considering a long; after it clears liquidity above, wait for a Sell signal before considering a short.
- The greater the volume of liquidity that the price has taken, the higher the chance of a rebound.
- It works best in the trend direction and in sideways markets on higher timeframes.
- Experienced traders can open trades earlier without waiting for the signal.
Did this guide help?
Thank you. Your answer was recorded.
Thank you for your feedback. You can continue in the English-language Midas bot. Open the English bot
Test Midas on your own TradingView chart
- Seven days free: Midas Up and Midas Down on your TradingView chart
- No card or prepayment: access is linked to one public TradingView username
- Markets available on TradingView and timeframes from one minute to one month; choose settings for the asset and trading style
No card. No payment. A TradingView username is public; never send a password.
8,400+ Midas indicator installations · 300+ client reviews · active since 2024

