
The chart and indicators are open, but it is still unclear what to do next.
Manual analysis
After half an hour reviewing the trend, volume and levels, the decision is still based on intuition.
Analysis from Setup Master AI
A structured chart summary shows market direction, the entry zone and the factors that confirm the setup.
The signal is read, then the chart is parsed. The top indicator Midas Up answers the question "where": the trend and the areas in which the price will react. The bottom Midas Down to the question "when": the moment of the wave reversal and the entry confirmation. Basic technique: determine the trend, find the strong zone, wait for confirmation.
There are two ways to review the setup. For a quick summary, hover over the BUY or SELL icon to see market sentiment and readings from both indicators. For a complete analysis, Setup Master AI reviews the signal, trend, levels, volume and volatility step by step, then organises the chart context into a trading plan.

Updated: · Midas Team
System logic: Midas Up shows where, Midas Down shows when
The two indicators answer different questions. Midas Up shows where price may react by identifying trend direction and areas of interest. Midas Down shows when a price-wave reversal may confirm the timing of an entry or exit.
The basic workflow has three steps: identify the trend, find a strong level, then confirm the price reaction and entry timing.
Identify the trend
Open the chart and look at the upper indicator. The first task is not to find an entry, but to answer the question "Which direction do I want to trade?" The EMA colour and price channel show the direction, making it clear even to a beginner. A yellow channel and crossing EMAs indicate a sideways market with many noisy signals; beginners are better off skipping these assets.
The price channel and EMA show the trend direction in color Finding areas of interest
Then find the area where price is most likely to react so you can consider an entry near the beginning of a move, not at its end. The upper indicator marks channel boundaries and support and resistance automatically. In a clear trend, work from channel boundaries in the trend direction; in a sideways market, work from horizontal levels.
Automatic Support and Resistance Levels: Price Reactions Confirming entry time
Once the direction and zone are known, wait for price to reach that area and provide confirmation. Avoid entries without a zone; this removes many emotion-driven entries. When price reaches the zone, wait for a Buy or Sell signal and check the lower indicator for current confirmation. Start with the trend ribbon, which marks reversal points and smooths noise.
Trend ribbon of the lower indicator: moments of price reversal
Two ways to review a market situation
Keep that framework in mind; Midas itself helps you analyse a specific trade, either quickly or in detail.
The quickest way is to hover over the BUY or SELL icon, and the pop-up prompt will instantly gauge the mood in the market and the position of each indicator. The most profitable entry points are when the market sentiment changes.
You don’t have to spend time studying each line on the chart: look at the summary and immediately see the essence of those analysis.
- Red circle - an indicator indicates a drop in price.
- The green circle indicates an increase in price.
- Number of circles - the strength of the signal of the indicator.
A common trading problem is not a lack of signals but a lack of clarity: many levels and movements compete for attention while a decision is needed now. Setup Master organises the chart into a clear scenario using the Midas trading system.
The mode answers the questions that matter at decision time: what is happening in the market, whether the setup is strong enough, whether to enter or wait, and what the actual action plan is rather than merely showing an attractive chart.
It's included in the settings by selecting a mode, designed to work from a computer, and it's counted in the six steps below.
Signal confluence score
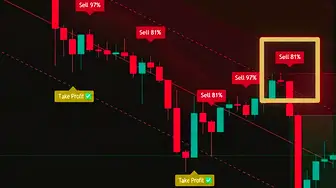
We've been training the indicator for a long time to analyze dozens of factors and do instant technical analysis -- every BUY and SELL signal has a score: it counts how many factors converged on a 30-point scale and converts the score to percentages, it's a matching estimate, not a probability of working out.
This assessment is an additional confirmation of any setup, it removes subjectivity from analysis: following strong signals can improve your strategy and reduce risks.
After testing on historical data, you can turn on the setting “Display signals with reliability at least” – specify the minimum value in percentages to hide unnecessary and unreliable signals.
Setup Master: six analysis steps
The analysis is not assembled “by eye”: the indicator reviews the chart through the Midas system step by step without omitting any factor. The result is a complete real-time chart analysis and a clear action plan focused on protecting capital rather than chasing unrealistic profit multiples.
Signal definition
The current alert is first determined – it will be the starting point of analysis and checked for compliance with all subsequent steps to warn about risks or “dissuade” from clearly bad trades.
signal-line Trend analysis
As a textbook analysis begins with an assessment of the current trend. Midas looks at the direction, estimates the strength of the trend in percentages and displays it on a convenient scale, clearly demonstrating the situation in the market.
Trend line: direction and strength in percentage Level analysis
The second Midas is support and resistance levels: the indicator understands where the price is relative to the nearest strong levels, excludes risky trades “to the level” and, vice versa, highlights good entry points “from levels” in the direction of the trend.
Level line: price between levels, without support Volume analysis
Next, trading volume is assessed: a move supported by volume is stronger and more reliable. A move without volume may be a weak impulse, a false breakout or a random spike - noise worth flagging.
volume-line Volatility analysis
Volatility is also taken into account - to give the most accurate recommendations for installing a stop: when it is low, the stop can be done less and reduce risk; when high, it is better to increase so that it does not knock out with wicks.
volatility-line Summary
Next, the rest of the scripts built into Midas are checked, and as a result you get a ready-made market analysis with a chart analysis, risk assessment and an action plan.
What the analysis shows
Instead of a situation like “there is something on the chart, but it is not clear how strong the entry is,” you get a structured analysis and quickly understand what you are facing: an interesting setup or noise that is better left alone.
The mode helps answer the main questions quickly:
- What's going on on the chart now?
- Is there a strong point of interest here?
- Does the market confirm the idea of entry?
- Should I enter now, wait or miss the asset altogether?
Setup Master is especially useful when the market looks “likely interesting” but not certain, it helps to remove subjectivity, reduce analysis time and focus only on situations where there is a clear trading scenario.
When to use Setup Master
Get to the situation quicker.
Instead of a long manual analysis, Setup Master AI immediately collects the main factors of a trade into one picture, especially when you are following multiple assets and do not want to spend much time on each chart.
Weed out weak entrances
One of the mode's core benefits is not just finding a trade, but filtering out weak scenarios that only look attractive at first glance.
More confidence before entering
When you see not just a signal, but a complete analysis of the context, the decision is made more calmly and systematically.
Three operating modes and when to use each
Midas has three operating modes, each designed for a different task. Switching modes lets you remove unnecessary chart elements and keep only what you need now.
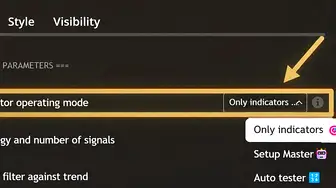
The mode changes at any time: the gear next to the indicator name, then the highest point of the list - "Indicator mode".
The main chart-analysis mode retains the core indicators: automatic support and resistance levels, the price channel with trend lines, the horizontal volume profile, large-participant movements and money flow. Disable anything unnecessary in settings to keep the chart clear.
- When you need to analyse the chart manually without distractions.
- When you want to see the market without overloading.
- When you are just familiar with the logic Midas.
- When trading from the phone, this is the most convenient mode for a small screen.
Setup Master adds a real-time analysis to the chart, combining the trend, levels, volume, volatility and current signal into a clear summary with an action plan.
- When you need to understand a particular situation more deeply.
- When you want to test your idea before entering.
- When learning to read a chart and build a setup systematically.
- When you want to save time on the market.
Settings Check mode hides the chart indicators and displays a table of historical signal results for the month and year. Signals are not redrawn, so the statistics reflect the recorded historical results.
- When you want to test a new strategy or settings.
- When comparing different indicators with each other.
- When you want to understand how the instrument behaves in a particular market.
- When you need to quickly evaluate statistics without manually scrolling the graph.
How to enable Setup Master
Open the indicator settings
The gear next to the indicator name on the chart.
Select Setup Master mode
Modes are the highest point in the settings list.
item "Indicator mode" and list of modes
Setup Master questions and recommendations
What is Setup Master AI in simple words?
This is the Midas mode, in which the indicator not only shows the elements on the chart, but collects a complete analysis of the situation taking into account the trend, volume, volatility and current signal, so that you quickly understand what is happening in the market and which action plan now looks more logical.
When is it better to include Setup Master AI?
When you need not a quick look at the chart, but a deep analysis of the transaction: before entering, for self-checking or for training in the live market.
How is Setup Master AI different from Indicators Only?
Indicators Only is more suitable for basic manual analysis, and Setup Master AI is more suitable for situations where you want to get an already collected interpretation of the graph and a clear action scenario, rather than reading all the elements separately.
Is Setup Master AI suitable for beginners?
Yes, especially if it's hard to get a picture of the market from different factors, it helps you to see the overall context of the trade faster and understand why the setup looks stronger or weaker, rather than looking at one signal in isolation from the market.
Can I use Setup Master AI from my phone?
It is better to use Setup Master AI on a computer so the chart does not become overloaded; on a phone, use the “Indicators Only” mode.
Does Setup Master AI replace my own analysis?
No, it's not autopilot or magic button, but rather, it's a booster for your analysis that helps you see the strengths and weaknesses of a trade faster.
Does it help to weed out weak trades?
Yes, this is one of the main practical benefits: it is necessary not only to find interesting situations, but also to quickly understand where the setup looks weak, controversial or not of sufficient quality for entry.
Where to look at the statistics on signals?
The indicator calculates stop-loss outcomes and peak profit for successful trades directly on the chart. To review the settings across historical data, use Auto Tester mode as described in step 6 of the route.
Did this guide help?
Thank you. Your answer was recorded.
Thank you for your feedback. You can continue in the English-language Midas bot. Open the English bot
Test Midas on your own TradingView chart
- Seven days free: Midas Up and Midas Down on your TradingView chart
- No card or prepayment: access is linked to one public TradingView username
- Markets available on TradingView and timeframes from one minute to one month; choose settings for the asset and trading style
No card. No payment. A TradingView username is public; never send a password.
8,400+ Midas indicator installations · 300+ client reviews · active since 2024

