
A sharp impulse has already happened: chasing it feels risky and late, while the pullback occurs without you.
Chasing a candle
You enter at the emotional peak and hit the stop within minutes.
Scanner work
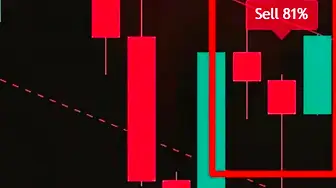
Pump and Dump moves are marked on the chart, showing where to wait for a pullback so you can follow a plan rather than react emotionally.
Pump & Dump is a separate indicator for traders who work with quick pullbacks after strong moves. It does not issue an immediate entry command: first it identifies an abnormally sharp rise or fall, then waits for price to begin pulling back, and only then provides a signal with targets, a stop and a position projection.
The indicator combines three parts: a sharp-move screener, a pullback signal module and a tester with statistics for detected signals across available chart history. It can be configured for TradingView markets and timeframes from one minute to one month and is included with plans of six months or longer.
Updated: · Midas Team
How the indicator is organised
Inside, the indicator works as a bundle of three modules – each is responsible for its own piece of the trade.
Pump and Dump screener
Automatically tracks sharp price movements on the chart: pumps are strong moves up, while dumps are sharp moves down. Settings are selected for a specific asset across TradingView markets and timeframes from one minute to one month.
Signal module
After finding the impulse, the indicator does not merely identify a pump or dump. It looks for a potential entry into the pullback, aiming to catch the reverse move as early as possible according to the selected logic and filters.
Once the pullback is identified, the indicator places a signal on the chart, calculates the nearest targets and stop, and displays a position projection with the risk-to-reward ratio. It can then track the trade and send alerts to the TradingView app or Telegram.
The strategy idea
After powerful pumps and dumps, the market very often pulls back quickly. These are the moves that Pump & Dump is designed to capture.
This is especially true in a market where there are many weak, overheated and speculative assets: the more junk impulses and chaotic accelerations, the more often there are situations where the price first flies too far, and then just as quickly returns back.
- After sudden impulses, the price often rolls back in a few candles, and not in a few days - manually such moments are almost impossible to track.
- Such moves often create a clear, understandable scenario: the market became overextended, profit-taking began, and a pullback followed.
- The strategy can be adapted to the market phase: in a bull market, review Buy setups after sharp drops; in a bear market, review Sell setups after pumps and upward accelerations.
What are pumps and dumps in simple words?
A pump is a sharp price move up; a dump is a similarly sharp move down. Pump & Dump is an indicator for finding and analysing pullbacks after these moves.
The script first acts as a screener to find strong impulse moves, then as a signal bot to identify an entry into the reverse move using the selected logic: either at the start of the pullback or through a more precise bounce from a strong level.
The indicator can be adjusted to different assets and timeframes, helps filter out noise, supports TradingView and Telegram alerts, and provides position-management tools: a stop, take-profit targets and a trailing stop.
It is designed for traders who want to work systematically with fast moves and their pullbacks without constantly monitoring charts manually.
The main benefits of the indicator
In short, it is useful in the work:
- It finds a complete setup rather than a move alone: overheating, a pullback and then a possible entry.
- It is designed for fast trades because pullbacks after an impulse can develop quickly.
- ⚙️ Adjust it for the selected asset and timeframe, from aggressive scalping to rarer high-confluence setups.
- Filters out noise using impulse size, speed, waiting time, pullback depth and candle confirmation.
- 🔄 Adapt it to the market phase: in a rising market, review Buy setups after dumps; in a weak market, review Sell setups after pumps.
- 🔔 It monitors dozens of charts and sends an alert when the selected conditions are met.
- Autotester helps to choose a working bunch of settings, not guessing.
Who's good and who's not.
It suits traders who work with fast impulse moves and volatile assets and want a systematic way to trade pullbacks after overheating without monitoring charts continuously.
It doesn't work like a cash button: without stops, a plan and a reasonable risk, no indicator can save you; it speeds up the selection of situations and the decision, but the result is based on your discipline.
How the Pump and Dump screener works
The first part of the indicator tracks strong impulse moves: sharp rises, aggressive falls and brief periods of market overheating that are often followed by a pullback.
You can determine which movements are considered important:
- Look for only pumps, only dumps or both directions.
- Minimum impulse size in percent, which can be adjusted for the selected asset and timeframe from one minute to one month.
- Maximum number of candles in which the pump must occur, filtering out slow moves with no clear pullback.
- How many candles after the impulse to wait for a signal, so that only quick pullbacks are considered.
- The pullback-depth filter at entry helps avoid entering too late, near the end of the pullback.
How the signal module works
Once the momentum is found, the indicator does not just mark the pump or the dump on the chart, but waits for the conditions to enter and helps structure the position tracking, and first you need to choose the mode of receiving signals.
Start of Pullback mode: earlier entry, more signals
The signal appears on the very first candles, when the price only begins to roll back after the impulse.
It is suitable for those who want to come in as early as possible, receive more signals and work more aggressively.
Pros: early entry, quick trades, more opportunities. Cons: less confirmation and more sensitivity to noise.
Rebound from Level Mode: Less Signals, Higher Accuracy
The signal appears after price reacts at a strong higher-timeframe level: price pierces the level but the candle body fails to close beyond it. A bounce begins and a signal appears.
Suitable for traders who want fewer signals, more confirmation and a more conservative style.
Pros: more noise filtering, better entry points, logic closer to the classic price action.
Stop-loss and trade management
Then you have to adjust the stop loss, and by default, the stop is considered for each position individually, taking into account the current volatility and the ATR, so that you reduce the risk, and you can change the stop multiplier to yourself: increase or decrease in percentage, proportional to the initial value.
After setting up, you will see hints on the chart: where are the goals and stops and what is the risk-to-profit estimate.
Alerts and Telegram notifications
The indicator does not require you to monitor the chart continuously: it supports TradingView alerts and can send signals to Telegram.
- Track impulses for several assets at once.
- Avoid missing quick pullback trades.
- You do not need to monitor the chart continuously: the notification arrives automatically, while the entry decision remains yours.
Tune the mode for the selected market
One of the main strengths of Pump & Dump is that it is not just a signal, but a logic constructor for your trading style.
Direction of trade
Just pumps, just dumps, or both, which is convenient if you want to work only in the market, adjust to the cycle phase, and not mix long and short scenarios in the same system.
Minimum pulse size
This filters out small moves and retains only stronger pumps and dumps. A higher value reduces noise and signal frequency but requires a larger impulse before a setup is considered.
Pulse velocity
You can specify how many candles the move must occur within. This matters: a rapid pump is not the same as a gradual rise, just as a rapid dump differs from an ordinary correction. The indicator is designed for sharp impulse moves, not every trending stretch.
How many candles wait for the signal after the pulse
If the price doesn't get in too long after finding a pump or dump, the script is considered irrelevant and resets, which helps you not to trade late signals, not to enter old movements, and concentrate only on fresh retracements.
Recoil depth filter
One of the most useful filters: if price has already retraced too much of the impulse by the time a signal appears, the entry is skipped. Why this matters:
- Do not enter the late phase of the movement.
- Do not catch the remnants when most of the move has already occurred.
- Maintain an adequate risk-to-potential ratio.
Planned indicator features
The indicator is developing: in the next update, more flexible settings for the transaction support will be added.
- A trailing stop after the first, second or third target locks in part of the move while allowing profits to grow.
- ATR multiplier for trailing: less value - tighter trailing, more - more freedom of price.
- Waiting for a deal to close before a new signal is less doubles and cleaner statistics.
- Candle-close confirmation: less noise on lower timeframes, earlier entry on higher timeframes.
Did this guide help?
Thank you. Your answer was recorded.
Thank you for your feedback. You can continue in the English-language Midas bot. Open the English bot
The demo includes only Midas Up and Midas Down. The full Midas toolset requires a paid plan.
Test Midas on your own TradingView chart
- Seven days free: Midas Up and Midas Down on your TradingView chart
- No card or prepayment: access is linked to one public TradingView username
- Markets available on TradingView and timeframes from one minute to one month; choose settings for the asset and trading style
No card. No payment. A TradingView username is public; never send a password.
8,400+ Midas indicator installations · 300+ client reviews · active since 2024

