
Price is rising while money is already leaving the asset, a divergence that candles alone do not reveal.
Entry without money-flow support
The move fades immediately after entry because buying pressure has already disappeared.
Entry confirmed by flow
You can see whether money is entering or leaving the asset, so confirmation appears before entry rather than after it.
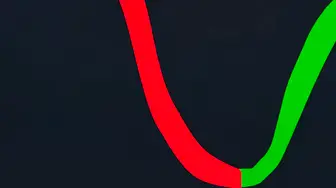
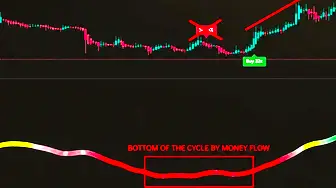
Money flow shows how intensely capital enters or leaves an asset. A rising flow means money is entering and the trend is bullish; a falling flow means money is leaving and the trend is bearish. The green zone marks a market peak, the red zone a market bottom, and dots on the line mark possible trend reversals.
A standard money-flow indicator shows only local impulses, so traders may buy when money is already leaving the asset. Midas uses a smooth line that filters short-term fluctuations and highlights the global trend set by large participants. Price tends to follow money flow, making it a useful guide to the broader trend.
Updated: · Midas Team
How money flow appears on the chart
Analysing money flow shows how intensely capital enters or leaves an asset, but the global trend matters. A standard indicator shows local impulses rather than the full picture, so traders may buy while money is already leaving the asset.
Midas presents money flow as a smooth line that filters short-term fluctuations and focuses on global flows, helping identify stable trends set by large participants.
- The flow is growing - money comes to the asset, the trend is bullish.
- The flow is falling - money is leaving the asset, the trend is bearish.
- The green zone is the peak of the market.
- The red zone is the bottom of the market.
- A point on the flow is the place of a trend reversal.
The flow line goes up, money goes into the asset, and then the price goes up, and that's the background for buying.
The flow line goes down, money goes out, the price goes down, and in those times, look for trades to sell, and don't buy against the flow.
When the flow enters the red zone, dots on the line indicate a possible market bottom and reversal attempt. A turn after one or more dots helps confirm that a new trend may be forming.
How to use money-flow context
Price follows capital flows, so money flow helps show the broader trend to follow.
- When money flows into an asset, the flow goes up – so does the price: look for buy deals.
- When money is withdrawn from an asset, the flow goes down – the price falls too: look for trades to sell.
- For spot positions, the red zone near a market bottom can provide an area for building a position.
- The best time to sell is at the peak of the market, at the highs of the green zone.
- If money flow is rising, shorting against big players is dangerous – filter false signals against the trend.
Is money flow suitable for investment strategies?
Yes. On higher timeframes, money flow can help identify a broader market bottom and support building a position in parts as reversal points appear.
A simple money-flow workflow
We use signals and money flow. When the price comes out of the red bottom of the money flow and starts to rise, we wait for Buy signals in the direction of growth and open the long. When the price has passed the green peak of money flow and started to fall, we wait for Sell signals in the direction of the fall and open the shorts.
It works best in continuation of the trend - always look at the direction of the flow. Experienced traders can open trades earlier or gain positions in parts.
Did this guide help?
Thank you. Your answer was recorded.
Thank you for your feedback. You can continue in the English-language Midas bot. Open the English bot
Test Midas on your own TradingView chart
- Seven days free: Midas Up and Midas Down on your TradingView chart
- No card or prepayment: access is linked to one public TradingView username
- Markets available on TradingView and timeframes from one minute to one month; choose settings for the asset and trading style
No card. No payment. A TradingView username is public; never send a password.
8,400+ Midas indicator installations · 300+ client reviews · active since 2024

