
A trend judged by eye is subjective: the same candle looks like growth to one trader and a pullback to another.
Direction by intuition
You enter against the main move because a local impulse catches your attention.
EMA direction
Four moving averages show the trend and its strength; their alignment reveals whether the move is healthy or fading.
Midas Up includes four popular exponential moving averages: EMA 20, 50, 100 and 200. Their colour changes automatically with the global trend: green lines indicate a rising market and red lines a falling market. Thickness and brightness identify the period: EMA 20 is the thinnest and brightest, while EMA 200 is the thickest and dimmest.
The direction and relative position of the lines answer the first question of analysis: is the market trending or sideways? Lines aligned in order like a fan indicate a strong trend; intertwined lines that change colour indicate a sideways market, where it is usually better not to trade. The lines also act as dynamic trend levels: price often rebounds from EMA 20 or 50, while EMA 200 supports longer-term moves.

Updated: · Midas Team
How EMA lines appear on the chart
The indicator displays four popular moving averages: EMA 20, 50, 100 and 200:
- The color of the lines automatically changes when the global trend breaks, to quickly understand the mood of the market.
- Line thickness and brightness show the period: EMA 20 is the thinnest and brightest, while EMA 200 is the thickest and dimmest, so the averages are easy to distinguish.
- The direction and position of the lines help distinguish a trend from a sideways market.
The green lines of the EMA lined up in order and pointing upwards, indicating a strong bullish trend.
One can consider long trades when the price is in the EMA 20 or 50: there is often a rebound of the price from the EMA line as from support.
The green lines of the EMA cross each other, but point upwards, indicating a bullish trend and strong corrections.
One can consider long trades when the price is in touch with the EMA 200 – a strong level from which price bounces as support often.
The red lines of the EMA are lined up in order and pointing downwards, indicating a strong bearish trend.
You can consider short trades when the price is in the EMA 20 or 50: there is often a price rebound from the EMA line as from resistance.
The red lines of the EMA cross each other, but point downwards, indicating a bearish trend and strong corrections.
You can consider short trades when the price is in touch with the EMA 200 – a strong level from which price bounces as resistance often.
EMA lines are grouped, often overlapping and changing color – this indicates a lateral movement and the absence of a clear trend.
In this case, consider rebounds from the nearest support and resistance levels that contain price from above and below.
How to use EMA context
EMA lines often act as trend lines from which the price can bounce:
- During a trend, price often rebounds from EMA 20 or 50; at that point, you can consider a trade in the trend direction.
- The EMA 200 plays the role of a key support or resistance level for long-term movements - a rebound can be expected when the price approaches the 200 line.
- Use the EMA direction to filter false signals against the trend.
When a strong bullish trend begins, the first upward rebounds often occur from EMA 20 or EMA 50 without deep pullbacks; price may barely touch the moving average.
When a strong bearish trend begins, the first downward rebounds often occur from EMA 20 or EMA 50 without deep pullbacks; price may barely touch the moving average.
An upward bounce from EMA 200 often includes a false breakout: price accelerates sharply before breaking through, then returns just as sharply to the other side of the level. Candles may have long wicks.
Given this, it is better to open a position after the appearance of confirmations of a price reversal on the lower indicator.
A downward bounce from EMA 200 often includes a false breakout: price accelerates sharply before breaking through, then returns just as sharply to the other side of the level. Candles may have long wicks.
Given this, it is better to open a position after the appearance of confirmations of a price reversal on the lower indicator.
A simple EMA trading workflow
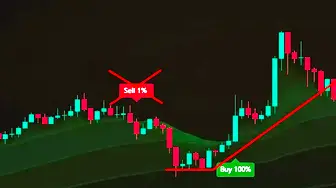
Use the moving EMAs together with signals: when price pulls back to a green EMA, wait for a Buy signal before considering a long; when price rises to a red EMA, wait for a Sell signal before considering a short.
- It only works in continuation of the current trend.
- Skip signals in a sideways market or against the trend, as shown in the screenshot.
- Experienced traders can open trades earlier without waiting for the signal.
Did this guide help?
Thank you. Your answer was recorded.
Thank you for your feedback. You can continue in the English-language Midas bot. Open the English bot
Test Midas on your own TradingView chart
- Seven days free: Midas Up and Midas Down on your TradingView chart
- No card or prepayment: access is linked to one public TradingView username
- Markets available on TradingView and timeframes from one minute to one month; choose settings for the asset and trading style
No card. No payment. A TradingView username is public; never send a password.
8,400+ Midas indicator installations · 300+ client reviews · active since 2024

