
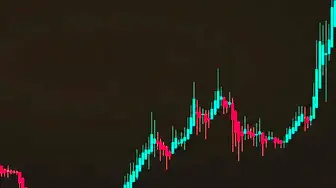
A large participant is quietly building a position while retail traders enter near the peak.
Entrance with the crowd
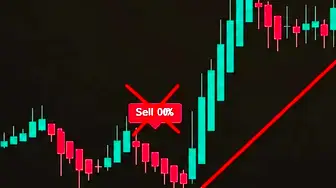
You buy during distribution while large participants are already closing positions.
Entry with large participants
Accumulation, impulse and distribution phases are visible, helping you follow large participants rather than trade against them.
The indicator analyses volume and abnormal moves to show large-participant activity. A yellow histogram marks market phases: below the centre line it shows accumulation by buyers, above it distribution by sellers, and bar height shows pressure strength. Purple waves show impulse buying or selling, while yellow circles warn of possible Pump and Dump conditions.
The yellow histogram represents accumulation or distribution pressure. When it disappears, that phase has ended and a reversal may follow. Seeing where large participants build and close positions helps you trade with the dominant market force rather than against it.
Video lessons on this topic
Updated: · Midas Team
Large-participant pressure: accumulation and distribution
The indicator analyzes volumes and abnormal movements in the market to identify the activity of large players who can move the entire market.
The yellow histogram shows the phases of accumulation and distribution and indicates exactly when whales enter or exit the market.
- At the bottom is buyer pressure: areas where big players accumulate assets.
- At the top is seller pressure: zones where big players sell assets.
- The height of the histogram indicates the strength of the pressure: the higher, the greater the pressure.
Impulse market buys by large participants
Purple waves highlight moments of impulse buying or selling by large participants.
- At the bottom, big purchases: big money pours into the market.
- On top of that, big sales: big money is being withdrawn from the market.
- The wave height indicates the volume of operations: the higher the wave, the larger the volume.
- The peak wave shows the zone in which the entry point most often folds.
Pump and Dump conditions
Yellow circles mark moments when a large participant may be trying to pump or dump the market. These conditions involve unusually large trades executed with market orders.
- A circle below price indicates potential preparation for an upward pump.
- A circle above price indicates potential preparation for a downward dump.
- The brightness of the circle shows the strength of the pump or dump.
How to use the large-participant model
Whales dictate the market: knowing where they are gaining or closing positions, you are trading with the strongest players, not against them.
The yellow histogram shows possible accumulation near the bottom or distribution near the top. When the histogram disappears, the phase has ended and a reversal may follow.
Purple waves and yellow circles are used to find the exact points for a set of positions: wave peaks and circles are the places where whales open their maximum positions, and this may be the best entry point for a trade.
- As long as there is a yellow histogram at the bottom, there is a phase of accumulation; when it ends, the price often turns upwards - this is the zone where you should wait for a buy signal.
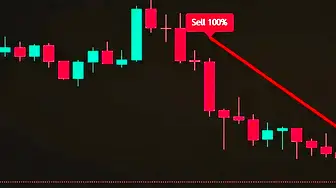
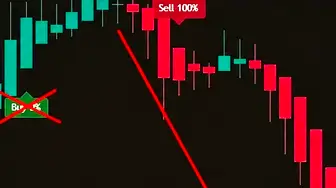
- As long as there is a yellow histogram on top, the distribution phase is in progress; when it ends, the price reverses and goes down, at which point you have to sell.
After the end of the impulse buying phase, the price goes up, the long entry point is the end of the yellow histogram.
After the distribution phase ends, the price goes down, and the short entry point is the end of the yellow histogram.
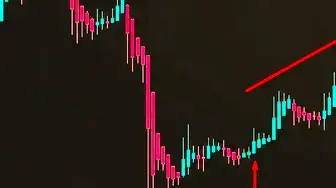
On the two-day timeframe, the bright yellow circle marked the absolute market bottom very accurately. On higher timeframes, this is a very strong signal of a trend ending and the market reversing.
The peaks of the purple waves coincide with price peaks, which can be used to build and close positions. There may be several peaks, so it is better to open and close positions in parts.
It works sideways and trend direction, and it makes a lot of noise against the trend.
A workflow for market phases
Use the large-participant pressure shown by the yellow histogram. When lower-pane accumulation pressure ends, wait for a Buy signal before considering a long trade. When upper-pane distribution pressure ends, wait for a Sell signal before considering a short trade.
- It works best in the trend direction and in sideways markets on higher timeframes.
- Experienced traders can open trades earlier without waiting for the signal.
A workflow for Pump and Dump conditions
We use the pump and dump signals -- bright yellow circles in the bottom indicator -- we have a pump -- we wait for Buy and we open the long, and we have a dump -- we wait for Sell and we open the shorts.
- It works best in the trend direction and in sideways markets on higher timeframes.
- For investing, the best entry points can be found on a two-day timeframe: there is a bright yellow circle - a very strong signal of the end of the trend and the market reversal.
Review impulses, peaks and dips
We use impulse whale purchases -- purple wave peaks. We have impulse purchases (peaks at the bottom) -- we wait for Buy and open the long. We have impulse sales (peaks at the top) -- we wait for Sell and we open the shorts.
Wave peaks often coincide with price peaks, which can be used to build and close positions. There may be several purple peaks, so it is better to open and close positions in parts. This works in sideways markets and in the trend direction; against the trend, it produces a lot of noise.
- It works best in the trend direction and in sideways markets on higher timeframes.
- Experienced traders can open trades in parts at the time of peak formation.
Combined workflow for large-participant activity
There are three tools at once: whale pressure, impulse purchases and pump and dump signals.
- It works best in the trend direction and in sideways markets on higher timeframes.
- Experienced traders can open trades earlier without waiting for the signal.
Define the cycle
We analyze the phases of accumulation and distribution by yellow histogram and wait for the desired cycle in continuation of the current trend.
We confirm the strength of a major player.
Additionally, we look at whether there are impulse purchases (purple waves) or pump and dump signals (yellow circles).
Enter after the signal
We receive the signal Buy or Sell and open a trade on the trend.
Did this guide help?
Thank you. Your answer was recorded.
Thank you for your feedback. You can continue in the English-language Midas bot. Open the English bot
Test Midas on your own TradingView chart
- Seven days free: Midas Up and Midas Down on your TradingView chart
- No card or prepayment: access is linked to one public TradingView username
- Markets available on TradingView and timeframes from one minute to one month; choose settings for the asset and trading style
No card. No payment. A TradingView username is public; never send a password.
8,400+ Midas indicator installations · 300+ client reviews · active since 2024

