
There are a dozen elements on the graph, and without decoding, half looks just decoration.
The badges aren't clear yet.
Half the markup is ignored, and the important warning looks like a random strip.
When the map is read
Each element has a clear purpose: where to wait for price, what confirms an entry and where to place the stop.
Two indicators share the work on the chart. Midas Up is drawn directly over price and includes moving EMAs, the price channel, horizontal levels, volume shelves, liquidity zones and candle hints. It helps explain where price is now and where it may move. Midas Down runs in a separate pane below the chart and includes money flow, the trend ribbon, momentum, large-participant activity, volume delta and the overbought/oversold scale. It helps determine whether it is time to enter or still too early.
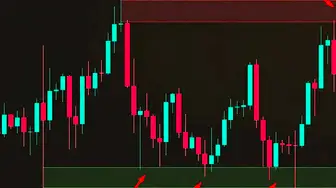
The signal is a BUY or SELL arrow on a candle. Beside it are the confluence score and a position projection with a stop-loss and three targets calculated from volatility and the nearest liquidity clusters. The sections below explain every element, starting with the overall chart map and then covering the upper and lower indicators in detail.
Updated: · Midas Team
Signal arrow, confluence score and position projection
A BUY or SELL arrow appears on a closed candle and no longer moves: signals do not repaint retroactively. Hover over the arrow to see a plain-language analysis and a circular reading for each built-in indicator: green for upward conditions, red for downward conditions, with more circles indicating greater strength.
- The percentage next to a signal is a score calculated on a 30-point scale from the number of converging factors. You can hide signals below a selected threshold in the settings.
- Position projection – the ready markup of the transaction: stop loss on current volatility (ATR) and three goals for the nearest areas of liquidity accumulation.
- A reliability assessment is a confirmation, not an order: it does not replace your strategy or guarantee signal performance.
Upper indicator: where price is located
All of this is drawn on top of the price, and you can see a detailed breakdown of each element on the top indicator page.
- Moving EMAs 20, 50, 100, 200 – The color shows the direction of the global trend, the lines themselves work in levels.
- The price channel is the direction and strength of the local trend, the channel boundaries work with support and resistance.
- Horizontal levels - the indicator finds the reversal zones and shows their strength: a weak level turned the price once, a strong one - two or more.
- The volume profile is the purple shelves where the maximum volumes have passed: a magnet for large players.
- The heat map of liquidity is strips of stop orders: under the price of the long stop, above the price of the shorts stop.
- Market pressure is a circle on a candle: the color shows who is pressing inside the candle, the size shows how much.
- Manipulation warns of a possible sharp upward or downward price move driven by a large participant.
- Divergence is a number in a circle: how many price divergences with oscillators the indicator found is an early sign of a reversal.
Lower indicator: whether timing is confirmed
A separate window under the graph, a detailed analysis on the bottom indicator page.
- Money flow is a long-term trend of big money: money enters an asset or exits.
- The trend ribbon shows the beginning and end of a medium-term trend and smooths noise in volatile markets.
- The price momentum is the strength and speed of the current wave, the point of reversal of the momentum.
- The pressure of the big players is the accumulation phase at the bottom and the distribution phase at the top.
- Large-participant buying and selling appears as purple waves: waves from below indicate buying pressure, while waves from above indicate selling pressure.
- Pump and Dump warnings are yellow circles that indicate a possible sharp move by a large participant; a brighter circle indicates a stronger signal.
- Delta volumes - who won inside the candle and with what advantage.
- The overheating scale is a detailed overbought and oversold on six oscillators at once.
Chart-reading order: top to bottom
Determine the trend by the top indicator
EMA color and channel color. Against the trend, signals work noticeably worse, which is the main reason for the beginner's losses.
Find the nearest areas of interest
Horizontal levels, shelves of volume, liquidity accumulations, price goes from zone to zone.
Wait for the signal by the zone.
Not in the middle of the void, but where the price reacts to the level.
Confirm the entry with the lower indicator
Money flow and momentum should point in the direction of the trade, not against it.
Detailed
Above is the map. Below is the specifics of each instrument: what it draws, how to read it, and where it's most often wrong.
Did this guide help?
Thank you. Your answer was recorded.
Thank you for your feedback. You can continue in the English-language Midas bot. Open the English bot
Test Midas on your own TradingView chart
- Seven days free: Midas Up and Midas Down on your TradingView chart
- No card or prepayment: access is linked to one public TradingView username
- Markets available on TradingView and timeframes from one minute to one month; choose settings for the asset and trading style
No card. No payment. A TradingView username is public; never send a password.
8,400+ Midas indicator installations · 300+ client reviews · active since 2024

